by Dr. Tony Phillips (Spaceweather.com)
Sept. 30, 2016: Researchers have long known that one of the van Allen Radiation Belts dips down toward Earth over South America, creating a zone of high radiation called “The South Atlantic Anomaly” (SAA). Since its discovery in 1958, the SAA has been shape-shifting, growing larger and intensifying. A map published just last week in the American Geophysical Union’s journal Space Weather Quarterly outlines the anomaly with new precision:

When a spacecraft in low-Earth orbit passes through the anomaly, “the radiation causes faults in spacecraft electronics and can induce false instrument readings,” explains Bob Schaefer of the Johns Hopkins University Applied Physics Lab, lead author of the paper reporting the results. “We actually used these spurious signals to map out the radiation environment at an altitude of 850 km.”
Specifically, they looked at pulses of noise in an ultraviolet photometer carried aboard many polar orbiting Defense Meteorological Satellite Program (DMSP) satellites. When high-energy protons in the SAA pass through these sensors, they produce spurious signals–or, in the case of this study, valuable data. By monitoring the rate of spurious UV pulses, the researchers were able to trace the outlines of the anomaly and monitor its evolution over a period of years.
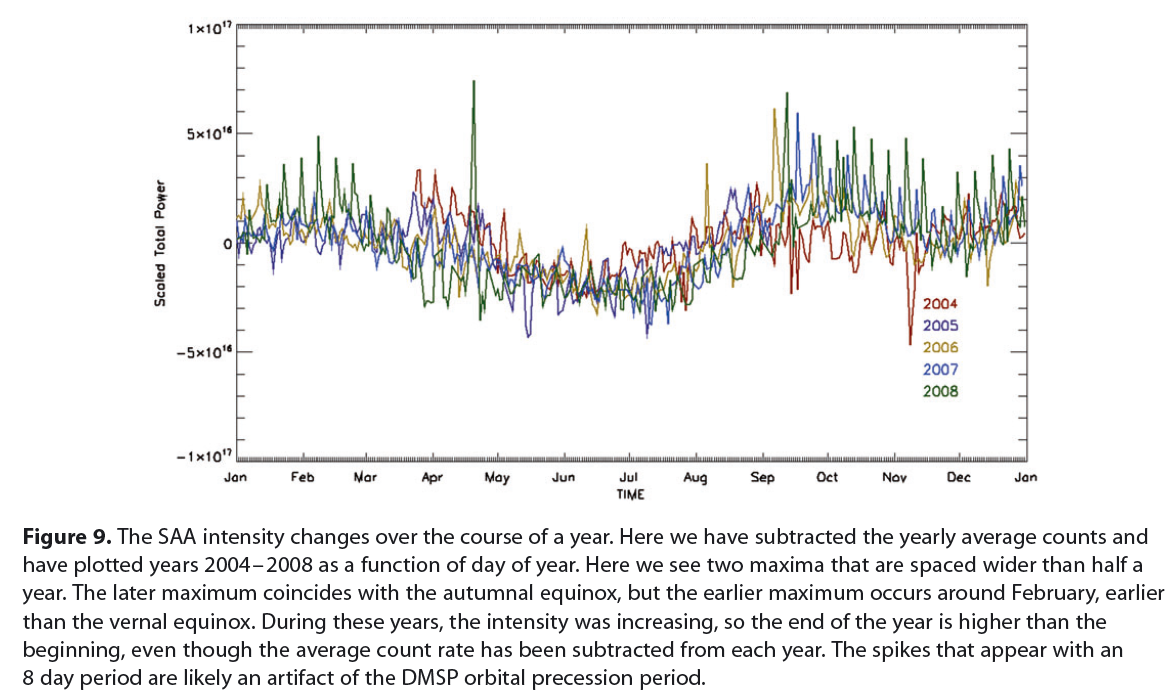
They found that the anomaly is slowly drifting north and west at rates of 0.16 deg/yr and 0.36 deg/yr, respectively. Currently, it is most intense over a broad region centered on Sao Paulo, Brazil, including much of Paraguay, Uruguay, and northern Argentina. They also detected a seasonal variation: On average, the SAA is most intense in February and again in September-October. In this plot, yearly average counts have been subtracted to reveal the double-peaked pattern:
 One maximum coincides with an equinox, but the other does not. The authors were not able to explain the origin of this unexpected pattern.
The solar cycle matters, too, as the data revealed a yin-yang anti-correlation with sunspots. “During years of high solar activity, the radiation intensity is lower, while during solar quiet years the radiation intensity is higher,” writes Schaefer.
According to orthodox thinking, the SAA reaches down from space to within about 200 km of Earth’s surface. Below that altitude, its effects should be mitigated by the shielding of Earth’s atmosphere and geomagnetic field. To test this idea, Spaceweather.com and Earth to Sky Calculus have undertaken a program to map the SAA from below using weather balloons equipped with radiation sensors. Next week we will share the results of our first flight from a launch site in Chile. Stay tuned!