The Chill of Solar Minimum

Sept. 27, 2018: The sun is entering one of the deepest Solar Minima of the Space Age. Sunspots have been absent for most of 2018, and the sun’s ultraviolet output has sharply dropped. New research shows that Earth’s upper atmosphere is responding.

“We see a cooling trend,” says Martin Mlynczak of NASA’s Langley Research Center. “High above Earth’s surface, near the edge of space, our atmosphere is losing heat energy. If current trends continue, it could soon set a Space Age record for cold.”

timed

Above: The TIMED satellite monitoring the temperature of the upper atmosphere

These results come from the SABER instrument onboard NASA’s TIMED satellite. SABER monitors infrared emissions from carbon dioxide (CO2) and nitric oxide (NO), two substances that play a key role in the energy balance of air 100 to 300 kilometers above our planet’s surface. By measuring the infrared glow of these molecules, SABER can assess the thermal state of gas at the very top of the atmosphere–a layer researchers call “the thermosphere.”

“The thermosphere always cools off during Solar Minimum. It’s one of the most important ways the solar cycle affects our planet,” explains Mlynczak, who is the associate principal investigator for SABER.

When the thermosphere cools, it shrinks, literally decreasing the radius of Earth’s atmosphere. This shrinkage decreases aerodynamic drag on satellites in low-Earth orbit, extending their lifetimes. That’s the good news. The bad news is, it also delays the natural decay of space junk, resulting in a more cluttered environment around Earth.

layers

Above: Layers of the atmosphere. Credit: NASA

To help keep track of what’s happening in the thermosphere, Mlynczak and colleagues recently introduced the “Thermosphere Climate Index” (TCI)–a number expressed in Watts that tells how much heat NO molecules are dumping into space. During Solar Maximum, TCI is high (“Hot”); during Solar Minimum, it is low (“Cold”).

“Right now, it is very low indeed,” says Mlynczak. “SABER is currently measuring 33 billion Watts of infrared power from NO. That’s 10 times smaller than we see during more active phases of the solar cycle.”

Although SABER has been in orbit for only 17 years, Mlynczak and colleagues recently calculated TCI going all the way back to the 1940s. “SABER taught us to do this by revealing how TCI depends on other variables such as geomagnetic activity and the sun’s UV output–things that have been measured for decades,” he explains.

tci

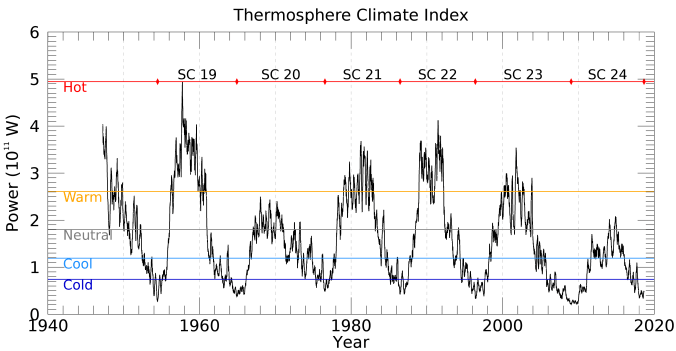
Above: An historical record of the Thermosphere Climate Index. Mlynczak and colleagues recently published a paper on the TCI showing that the state of the thermosphere can be discussed using a set of five plain language terms: Cold, Cool, Neutral, Warm, and Hot.

As 2018 comes to an end, the Thermosphere Climate Index is on the verge of setting a Space Age record for Cold. “We’re not there quite yet,” says Mlynczak, “but it could happen in a matter of months.”

“We are especially pleased that SABER is gathering information so important for tracking the effect of the Sun on our atmosphere,” says James Russell, SABER’s Principal Investigator at Hampton University. “A more than 16-year record of long-term changes in the thermal condition of the atmosphere more than 70 miles above the surface is something we did not expect for an instrument designed to last only 3-years in-orbit.”

Soon, the Thermosphere Climate Index will be added to Spaceweather.com as a regular data feed, so our readers can monitor the state of the upper atmosphere just as researchers do. Stay tuned for updates.

References:

Martin G. Mlynczak, Linda A. Hunt, James M. Russell, B. Thomas Marshall, Thermosphere climate indexes: Percentile ranges and adjectival descriptors, Journal of Atmospheric and Solar-Terrestrial Physics, https://doi.org/10.1016/j.jastp.2018.04.004

Mlynczak, M. G., L. A. Hunt, B. T. Marshall, J. M. RussellIII, C. J. Mertens, R. E. Thompson, and L. L. Gordley (2015), A combined solar and geomagnetic index for thermospheric climate. Geophys. Res. Lett., 42, 3677–3682. doi: 10.1002/2015GL064038.

Mlynczak, M. G., L. A. Hunt, J. M. Russell III, B. T. Marshall, C. J. Mertens, and R. E. Thompson (2016), The global infrared energy budget of the thermosphere from 1947 to 2016 and implications for solar variability, Geophys. Res. Lett., 43, 11,934–11,940, doi: 10.1002/2016GL070965

False claims of a coming ice age — https://climatefeedback.org/false-claims-coming-ice-age-ecosystem-unreliable-news-sites-blogs-social-media-accounts/


Japanese Robots Land on Asteroid Ryugu

 Sept. 22,, 2018: This weekend, Japan made history by deploying two rovers on the surface of a near-Earth asteroid. The mechanical explorers dropped from their mothership, Hayabusa2, less than 100 meters above Ryugu, and now they are hopping across the space rock’s cratered landscape. This picture was taken by Rover-1A in mid-hop:

Hopping is necessary because the asteroid’s gravity is too weak for simple rolling.  Instead of wheels, the rovers have rotating motors inside that allow them to shift their momentum and, thus, make little jumps across the asteroid’s rugged surface. Mission controllers are taking great care that the rovers, which measure 18 cm by 7 cm and weigh only 1 kg, do not fly into space.

As historic as this achievement is, it is only the beginning: Rover-1A and 1B are on a reconnaissance mission for two more robots slated to land later this year.  In October, Hayabusa2 will release MASCOT (Mobile Asteroid Surface Scout), a larger lander made by the German Aerospace Center. MASCOT will be followed, in turn, by another Japanese robot.


Above: Hayabasa2 photographs its own shadow on the asteroid. Credit: JAXA

Exploring Ryugu is important. Classified as a potentially hazardous asteroid, this 900-meter wide space rock can theoretically come closer to our planet than the Moon. This makes it a potential target for asteroid mining. Hayabasa2 will discover what valuable metals may be waiting there. Ryugu is also a very primitive body, possibly containing a chemical history of the formation of our solar system billions of years ago.

Launched in December 2014, Hayabusa2 reached asteroid Ryuga in June of this year. It is scheduled to orbit the asteroid for about a year and a half before returning to Earth in late 2020, carrying samples of Ryugu for analysis by researchers. Stay tuned for updates!

Student-Built Space Weather Satellite Targets Killer Electrons

Sept. 20, 2018: Last Saturday, a Delta II rocket blasted off at dawn from the Vandenberg AFB in California. Soon thereafter NASA reported the successful deployment of the ICESat-2 satellite, designed to make 3D laser images of Earth’s surface.

Here’s what most news stations did not report: A pair of tiny satellites were tucked inside the rocket, and they were successfully deployed as well. Built by students at UCLA, ELFIN-A and ELFIN-B are now orbiting Earth, monitoring the ebb and flow of “killer electrons” around our planet.

“We’ve just received our first downlink of data from ELFIN-A,” reports Ryan Caron, Development Engineer at UCLA’s Department of Earth, Planetary, and Space Sciences. Click to listen:

ELFIN-science-orbit-cutaway_strip

That may sound like ordinary static, but the signal is full of meaning. As mission controllers turn on ELFIN’s science instruments, the static-y waveforms will carry unique information about particles raining down on Earth from the inner Van Allen Radiation Belt.

“Sensors onboard our two cubesats detect electrons in the energy range 50 keV to 4.5 MeV,” says Caron. “These are the so-called ‘killer electrons,’ which can damage spacecraft and cause electrical disruptions on the ground. They also give rise to the majestic aurora borealis.”

“ELFIN is doing something new,” says Vassilis Angelopoulos, a UCLA space physicist who got his doctorate at UCLA and serves as ELFIN’s principal investigator. “No previous mission was able to measure the angle and energy of killer electrons as they rain down on Earth’s atmosphere. ELFIN will help us investigate how disturbances called ‘Electromagnetic Ion Cyclotron waves’ knock these electrons out of the Van Allen Belts and scatter them down toward Earth.”

ELFIN-A and ELFIN-B are cubesats, each weighing about eight pounds and roughly the size of a loaf of bread. They are remarkable not only for their cutting edge sensors, but also for their origin. The two satellites were almost completely designed and built by undergraduate students at UCLA. Working for more than 5 years, a succession of 250 students created the two Electron Losses and Fields Investigation CubeSats –“ELFIN” for short.

“Just seeing all the hundreds of hours of work, the many sleepless nights, the stressing out that you’re not going to make a deadline — just seeing it go up there … I’m probably going to cry,” says Jessica Artinger, an astrophysics major and geophysics and planetary science minor who helped build the satellites and witnessed their launch.

The ELFIN website has interactive tools so the public can track and listen to the spacecraft as it passes overhead twice a day. The CubeSats are expected to remain in space for two years, after which they will gradually fall out of orbit and burn up in the atmosphere like shooting stars.

ELFIN has been supported with funding from the National Science Foundation and NASA, with technical assistance from the Aerospace Corporation among other industry partners and universities.


Equinox Cracks in Earth’s Magnetic Field

Sept. 14, 2018: The northern autumnal equinox is only a week away. That means one thing: Cracks are opening in Earth’s magnetic field. Researchers have long known that during weeks around equinoxes fissures form in Earth’s magnetosphere. Solar wind can pour through the gaps to fuel bright displays of Northern Lights. Here’s an example from Yellowknife, Canada:

“On Sept. 5-6, we could see auroras in the sky all night long, with a bright outburst of pink shortly after midnight,” says photographer Yuichi Takasaka.

During the display, a weak stream of solar wind was blowing around Earth. At this time of year, that’s all it takes. Even a gentle gust can breach our planet’s magnetic defenses.

This is called the the “Russell-McPherron effect,” named after the researchers who first explained it. The cracks are opened by the solar wind itself. South-pointing magnetic fields inside the solar wind oppose Earth’s north-pointing magnetic field. North and South partially cancel one another, opening a crack. This cancellation can happen at any time of year, but it happens with greatest effect around the equinoxes. Indeed, a 75-year study shows that September is one of the most geomagnetically active months of the year–a direct result of “equinox cracks.”

NASA and European spacecraft have been detecting these cracks for years. Small ones are about the size of California, and many are wider than the entire planet. There’s no danger to people on Earth. Our planet’s atmosphere intercepts the rush of incoming particles with no harm done and a beautiful afterglow.

Stay tuned for more Arctic lights as autumn approaches.

Realtime Aurora Photo Gallery

Green Comet Makes Closest Approach to Earth

Sept. 9, 2018: On Sept. 10th, Comet 21P/Giacobini-Zinner (“21P” for short) makes its closest approach to Earth in 72 years–only 58 million km from our planet. The small but active comet is easy to see in small telescopes and binoculars shining like a 7th magnitude star. Michael Jäger of Weißenkirchen, Austria, photographed 21P approaching our planet on Sept. 9th:

“Comet 21P is currently in the constellation Auriga,” says Jäger. “I caught it just as it was passing by star clusters M36 and M38.”

The comet’s close approach to Earth coincides with a New Moon, providing a velvety-dark backdrop for astrophotography. The best time to look is during the dark hours before sunrise when the constellation Auriga is high in the eastern sky. If you have a GOTO telescope, use these orbital elements to point your optics. Detailed sky maps can help, too.

Shining just below the limit of naked-eye visibility, the comet will remain easy to photograph for the rest of September. If you can only mark one date on your calendar, however, make it Sept. 15th. On that night, 21P will cross directly through the middle of the star cluster M35 in the constellation Gemini. Astronomer Bob King writing for Sky and Telescope notes that “the binocular view should be unique with the rich cluster appearing to sprout a tail!”


Click to view an interactive 3D orbit of 21P/Giacobini-Zinner. Credit: NASA/JPL

21P/Giacobini-Zinner is the parent of the annual Draconid meteor shower, a bursty display that typically peaks on Oct. 8th. Will the shower will be extra-good this year? Draconid outbursts do tend to occur in years near the comet’s close approach to the sun. However, leading forecasters do not expect an outburst this year despite the comet’s flyby. In case they are mistaken, many eyes next month will be on the shower’s radiant in the constellation Draco.

Got a picture of Comet 21P/Giacobini-Zinner? Submit it here.

159 Years Ago, A Geomagnetic Megastorm

Sept. 2, 2018: Picture this: A billion-ton coronal mass ejection (CME) slams into Earth’s magnetic field. Campers in the Rocky Mountains wake up in the middle of the night, thinking that the glow they see is sunrise. No, it’s the Northern Lights. People in Cuba read their morning paper by the red illumination of aurora borealis. Earth is peppered by particles so energetic, they alter the chemistry of polar ice.

Hard to believe? It really happened 159 years ago. This map shows where auroras were sighted in the early hours of Sept. 2, 1859:

As the day unfolded, the gathering storm electrified telegraph lines, shocking technicians and setting their telegraph papers on fire. The “Victorian Internet” was knocked offline. Magnetometers around the world recorded strong disturbances in the planetary magnetic field for more than a week.

The cause of all this was an extraordinary solar flare witnessed the day before by British astronomer Richard Carrington. His sighting on Sept. 1, 1859, marked the discovery of solar flares and foreshadowed a new field of study: space weather. According to a NASA-funded study by the National Academy of Sciences, if a similar “Carrington Event” occurred today, it could cause substantial damage to society’s high-tech infrastructure and require years for complete recovery.

carrsket

In Sept. 1859, this large sunspot unleashed a record-setting solar flare. Sketch by R. C. Carrington.

Could it happen again? In fact, a similar event did happen only 6 years ago. On July 23, 2012, a powerful explosion on the sun hurled a Carrington-class CME away from the sun. Fortunately, it missed. “If it had hit, we would still be picking up the pieces,” says Prof. Daniel Baker of the University of Colorado, who summarized the event at NOAA’s Space Weather Workshop in 2014.

In a paper published just a few months ago, researchers from the University of Birmingham used Extreme Value Theory to estimate the average time between “Carrington-like flares.” Their best answer: ~100 years, a value which suggests we may be overdue for a really big storm.

Earth to Sky Cosmic Ray Sensors

When cosmic rays hit the top of Earth’s atmosphere, they create a spray of secondary radiation that rains down on the planet below. For years, the students of Earth to Sky Calculus have been measuring secondary cosmic rays on airplanes and high-altitude balloons using two types of sensors.

First, are the neutron bubble chambers:

neutronchambers_600

Each bubble pictured above is formed by an energetic neutron (200 keV – 15 MeV) passing through the chamber. Counting bubbles yields the total dose. We use chambers manufactured by Bubble Technology Industries Inc. of Canada.

Second, we monitor X-rays and gamma rays using sensors based on Geiger tubes:

xraygammaray

These are Polimaster 621M dosimeters sensitive to X-rays and gamma-rays. They sample energies between 10 keV and 20 MeV, spanning the range of medical X-ray machines, airport security devices, and “killer electrons” in Earth’s radiation belts.

Cosmic rays are a cocktail of different things: e.g., neutrons, protons, pions, electrons, X-rays, and gamma rays spanning a wide range of energies. Our sensors sample only three ingredients of that cocktail: neutrons, X-rays, gamma-rays. Furthermore, we are sampling only a relatively low range of energies. Many cosmic rays are much more energetic than the 15 MeV to 20 MeV upper limit of our detectors.

This means our data are only the tip of the iceberg.  Flight crews and passengers absorb even more radiation than we can detect.