Introducing, the Green Ghost

May 31, 2020: Want to discover something new? Keep an eye on the tops of thunderstorms. Sprites, trolls, elves and pixies: These are just a handful of the exotic phenomena that have surprised researchers monitoring cloudtops since the 1980s. In fact, a new one has just been discovered. Introducing, the Green Ghost.

Thomas Ashcraft captured one over New Mexico on May 25th. Play his movie, and look for the green afterglow following the flash of this magnificent jellyfish sprite:

vimeosplash

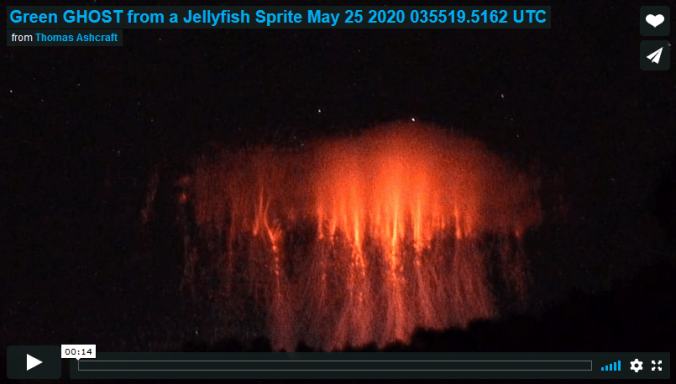
“In the past week I’ve captured two Green Ghosts over west Texas that were generated by strong peak current lightning strokes,” says Ashcraft. “The one on May 25th registered  118 kAmperes on the National Lightning Detection Network and saturated VLF lightning sensors as far away as great Britain and Germany.”

“As far as I know there are no scientific journal articles regarding this new phenomenon and a handful of citizen scientists are leading the way,” says Ashcraft.

Green Ghosts were discovered only 1 year ago by Hank Schyma, a Houston Texas-based storm chaser better known to his fans as Pecos Hank. “It was May 25, 2019,” recalls Schyma. “I video recorded some sprites over a storm in Oklahoma. Later, when I reviewed the footage, I noticed a mysterious green afterglow above some of the larger sprites.”

greenghost

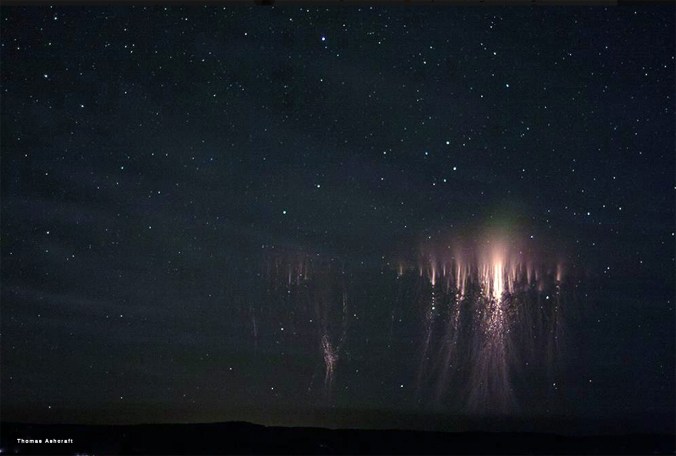
Above: From the archives of Thomas Ashcraft, a Green Ghost photographed in 2014. “At the time I did not realize what I had captured,” he says.

Schyma worked closely with another storm chaser, Paul M. Smith. “We shared the footage with scientists and others on social media. Nobody had heard of it before. Many argued it might be a camera sensor artifact. Over the following weeks and months, Paul captured multiple other ghosts at high resolution, silencing the skepticism.”

At the moment, no one knows for sure what causes Green Ghosts. Their color may be a clue. Green is commonly seen in auroras and airglow, two upper atmospheric phenomena that get their verdant hue from excited atoms of oxygen. The same could hold true for Green Ghosts. When the tops of strong sprites hit the airglow layer ~90 km above Earth’s surface, oxygen atoms might briefly glow green.

Right or wrong, this hypothesis inspired the name Ghost. “It is an acronym for Green emissions from excited Oxygen in Sprite Tops,” explains Schyma. “More importantly, we named them ghosts to maintain the theme of other transient luminous events such as sprites, trolls, elves and pixies.”

In the USA, sprite season is just getting underway as summer approaches, bringing severe electrical storms. Stay tuned for more ghost stories.


Noctilucent Clouds are Intensifying

May 28, 2020: On May 17th, NASA’s AIM spacecraft detected the first noctilucent clouds (NLCs) of summer. Those first electric-blue smudges were barely visible. Since then, however, the clouds have rapidly intensified. Recent images from orbit show a growing bank of NLCs pinwheeling just inside the Arctic Circle:

swirl2

NLCs are Earth’s highest clouds. Seeded by meteoroids, they float at the edge of space more than 80 km above the ground. The clouds form when summertime wisps of water vapor rise up to the mesosphere, allowing water to crystallize around specks of meteor smoke. Last summer, they spread as far south as Los Angeles and Las Vegas, setting records for low-latitude sightings.

It’s early in the 2020 season, so the clouds are still concentrated around the North Pole. Nevertheless, people in Europe are starting to see them. Johny Krahbichler sends this picture taken last night (May 26th) from Ängelholm, Sweden:

Johny-Krahbichler-night-glow_1590485077

“These night glowing clouds are pretty common during the summer here in Sweden,” says Krahbichler. “But it’s rare that they glow this brightly over such a large area. As soon as I saw them I ran to get my camera. The glow from the clouds ended up matching the glow of my LED strip inside!”

Noctilucent clouds have been likened to a great “geophysical light bulb” because they turn on abruptly, reaching almost full intensity over a period of ~10 days. By early June, therefore, we can expect the clouds to spread farther south with a significant increase in brightness. The circular rhythm of the pinwheel motion (caused by a 5-day planetary wave) may even allow us to start issuing predictions of latitude ranges where the clouds are most likely to appear.

Stay tuned for updates–and be alert for electric blue.

Realtime Noctilucent Cloud Photo Gallery
Free:
Spaceweather.com Newsletter

Is the South Atlantic Anomaly Splitting in Two?

May 26, 2020: New data from Europe’s Swarm satellites show something strange is afoot in Earth’s magnetic field. The South Atlantic Anomaly might be splitting in two. “A new, eastern minimum of the South Atlantic Anomaly has appeared over the last decade,” says Jürgen Matzka, from the German Research Center for Geosciences. “In recent years it has been developing vigorously.”

splash1

Above: Development of the South Atlantic Anomaly from 2014 to 2020. Credit: ESA/Swarm. [more]

The South Atlantic Anomaly is a weak spot in Earth’s magnetic field centered roughly on the Atlantic side of South America. Discovered in 1958, it has been growing and shifting for decades. The latest data from Swarm show a new weak spot forming just off the southern tip of Africa.

“We are very lucky to have the Swarm satellites in orbit to investigate this development,” says Matzka.

Launched in November 2013, Swarm is a constellation of 3 identical satellites flying in formation around Earth. They are equipped with magnetometers, star trackers and other instruments, which allow the satellites to make exquisitely detailed 3D measurements of Earth’s magnetic field. The possible splitting of the Anomaly is just one of the mission’s many significant findings.

Researchers have long known that Earth’s magnetic field is weakening. Over the last 200 years, the globally averaged magnetic field has lost around 9% of its strength, with the South Atlantic Anomaly leading the way. From 1970 to 2020, the minimum field strength in this area dropped from 24,000 nanoteslas to 22,000.

splash2

Above: Radiation strikes detected by Swarm are concentrated in the South Atlantic Anomaly. Credit: ESA

As the South Atlantic Anomaly has weakened, the inner Van Allen Belt has spilled into it, allowing energetic particles (especially protons) to get within 200 km of Earth’s surface. This poses little threat to people on the ground, but spacecraft  aren’t so lucky. When satellites fly through the Anomaly, they are exposed to relatively strong radiation. Onboard computers may reboot and digital cameras can be fogged by streaks of charged particles flying through them. The ISS has extra shielding to deal with this problem, and the Hubble Space Telescope doesn’t even bother to make observations when it is inside the Anomaly.

If the South Atlantic Anomaly eventually splits into two cells, satellite mission planners will have to contend with a new zone of high radiation. The splitting is more than just a nuisance, however. It could offer clues to the origin of the Anomaly itself.  Earth’s magnetic field is created by currents of superheated liquid iron swirling ~3000 km beneath our feet. Changes “up here” can tell researchers what’s going on “down there.”

Stay tuned for updates as the Swarm mission continues.

Noctilucent Cloud Season Has Begun

May 20, 2020: NASA’s AIM spacecraft has detected a noctilucent cloud (NLC) inside the Arctic Circle–the first of the 2020 summer season. It is the blue puff in this satellite image of the North Pole:

The detection on May 17th marks one of the earliest starts in the 14 year history of the spacecraft. “In previous years, we have seen the first NLCs appear between May 15th and May 27th,” says Cora Randall, a member of the AIM science team at the University of Colorado. “Only once, in 2013 (May 15th), has the northern season started earlier than this.”

NLCs are Earth’s highest clouds. Seeded by meteoroids, they float at the edge of space more than 80 km above the ground. The clouds form when summertime wisps of water vapor rise up to the mesosphere, allowing water to crystallize around specks of meteor smoke. Last summer, they spread as far south as Los Angeles and Las Vegas, setting records for low-latitude sightings.

To find out why NLCs appeared so early this year, Lynn Harvey of the University of Colorado’s Laboratory for Atmospheric and Space Physics looked at data from NASA’s Microwave Limb Sounder (MLS). The following plots show moisture and temperature in the mesosphere for the past 14 years, with 2020 traced in red:

“Between May 1st and May 17th, conditions in the mesosphere significantly cooled and moistened,” says Harvey, “such that 2020 became the second coldest and third wettest year in the AIM record.”

Noctilucent clouds have been likened to a great “geophysical light bulb” because they turn on abruptly, reaching almost full intensity over a period of no more than 5 to 10 days. This means the little blue puff could soon expand to cover most of the Arctic. Stay tuned!

Red and Green Ripples in the Sky

May 15, 2020: This week, an astronomer at the McDonald Observatory discovered a planet with fantastic red and green ripples in its atmosphere. It looks a lot like Texas.

On May 13th, around 10:30 pm, Stephen Hummel was walking across the observatory grounds when he noticed the flash of lightning from a distant thunderstorm. “I saw a large column of sprites and rushed to set up my camera on a ridge with a better view,” he says. “Aiming southeast towards the city of Alpine, Texas, I recorded this movie.”

Hummel’s movie is rare and beautiful. It shows alternating bands of red and green airglow gliding overhead like ripples in a giant pool of water, punctuated by red bolts of upward directed lightning. The flickering sprites were so bright, he could see them with his unaided eye.

“In a hurry not to miss any action, I hiked quickly up the ridge with my camera,” he recalls. “Out of breath, I heard the eerie but distinct sound of a mountain lion’s call. I left the camera running while I returned to the safety indoors, then gathered the footage later on, hoping for the best. I was amazed by the results and surprised the airglow was so evident.”

Both the sprites and the airglow-ripples came from a thunderstorm about 180 miles away. This weather radar map shows Hummel’s location (starred) and the instigating storm system:

radarmap

This was a convective storm with powerful updrafts. Essentially, the storm pounded the upper atmosphere from below, creating a bulls-eye pattern in the mesosphere more than 80 km above the ground. This pattern impressed itself upon the airglow layer, exciting and amplifying aurora-like colors which are usually too faint to see.

It’s no coincidence that Hummel saw sprites at the same time. Powerful convective storms produce strong lightning–both up and down. Hummel witnessed not only the bright glow of ordinary lightning bolts lancing down to Earth, but also the eerie forms of sprites reaching up to the edge of space. “The sprites were easily visible to the unaided eye,” he says.

“Thanks to the mountain lion,” he adds, “I recorded the whole thing.”

The Great Geomagnetic Storm of May 1921

May 12, 2020: 99 years ago this week, people around the world woke up to some unusual headlines.

“Telegraph Service Prostrated, Comet Not to Blame” — declared the Los Angeles Times on May 15, 1921. “Electrical Disturbance is ‘Worst Ever Known'” — reported the Chicago Daily Tribune. “Sunspot credited with Rail Tie-up” — deadpanned the New York Times.

newspapers2

They didn’t know it at the time, but those newspapers were covering the biggest solar storm of the 20th Century. Nothing quite like it has happened since.

It began on May 12, 1921 when giant sunspot AR1842, crossing the sun during the declining phase of Solar Cycle 15, began to flare. One explosion after another hurled coronal mass ejections (CMEs) directly toward Earth. For the next 3 days, CMEs rocked Earth’s magnetic field. Scientists around the world were surprised when their magnetometers suddenly went offscale, pens in strip chart recorders pegged uselessly to the top of the paper.

And then the fires began. Around 02:00 GMT on May 15th, a telegraph exchange in Sweden burst into flames. About an hour later, the same thing happened across the Atlantic in the village of Brewster, New York. Flames engulfed the switch-board at the Brewster station of the Central New England Railroad and quickly spread to destroy the whole building. That fire, along with another one about the same time in a railroad control tower near New York City’s Grand Central Station, is why the event is sometimes referred to as the “New York Railroad Superstorm.”

sunspot

A photograph (Royal Greenwich Observatory) and sketch (Mount Wilson Observatory) of sunspot AR1842 on May 13, 1921. Source: “The extreme solar storm of May 1921: observations and a complextopological model

What caused the fires? Electrical currents induced by geomagnetic activity surged through telephone and telegraph lines, heating them to the point of combustion. Strong currents disrupted telegraph systems in Australia, Brazil, Denmark, France, Japan, New Zealand, Norway, Sweden, the UK and USA. The Ottawa Journal reported that many long-distance telephone lines in New Brunswick were burned out by the storm. On some telegraph lines in the USA voltages spiked as high as 1000 V.

During the storm’s peak on May 15th, southern cities like Los Angeles and Atlanta felt like Fairbanks, with Northern Lights dancing overhead while telegraph lines crackled with geomagnetic currents. Auroras were seen in the USA as far south as Texas while, in the Pacific, red auroras were sighted from Samoa and Tonga and ships at sea crossing the equator.

What would happen if such a storm occurred today?

Researchers have long grappled with that question–most recently in a pair of in-depth papers published in the journal Space Weather: “The Great Storm of May 1921: An Exemplar of a Dangerous Space Weather Event” by Mike Hapgood (Rutherford Appleton Laboratory, UK) and “Intensity and Impact of the New York Railroad Superstorm of May 1921” by Jeffrey Love (US Geological Survey) and colleagues.

The summary, above, is largely a result of Hapgood’s work. He painstakingly searched historical records including scientific journals, newspaper clippings, and other reports to create a moment-by-moment timeline of the storm. Such timelines are invaluable to emergency planners, who can use them to prepare for future storms.

aurorasightings

Locations where auroras were sighted in May 1921. The leftmost red circle marks Apia, Samoa.

Jeffrey Love and colleagues also looked into the past and–jackpot!–they found some old magnetic chart recordings that did not go offscale when the May 1921 CMEs hit. Using the data, they calculated “Dst” (disturbance storm time index), a measure of geomagnetic activity favored by many space weather researchers.

“The storm attained an estimated maximum −Dst on 15 May of 907 ± 132 nT, an intensity comparable to that of the Carrington Event of 1859,” they wrote in their paper.

This dry-sounding result upends conventional wisdom. Students of space weather have long been taught that the Carrington Event (-Dst = 900 nT) was the strongest solar storm in recorded history. Now we know that the May 1921 storm was about equally intense.

If the May 1921 storm hit today, “I’d expect it to lead to most, if not all, of the impacts outlined in the 2013 Royal Academy of Engineering report led by Paul Cannon,” says Hapgood. “This could include regional power outages, profound changes to satellite orbits, and loss of radio-based technologies such as GPS. The disruption of GPS could significantly impact logistics and emergency services.”

It’s something to think about on the 99th anniversary of a 100-year storm….

Hyperbolic Comet SWAN

April 19, 2020:  Newly-discovered Comet SWAN (C/2020 F8) is shaping up to be a beauty. It looks great through small telescopes now, and could become visible to the naked eye next month. Gerald Rhemann sends this picture taken yesterday from Farm Tivoli, Namibia:

“The comet’s tail is almost a full degree long,” says Rhemann. “And it was an easy target for my 12-inch telescope at magnitude +7.5.”

Where does this beautiful comet come from? SWAN’s trajectory is an important clue. It’s falling toward the sun for the first time, and the sun’s gravity will probably slingshot Comet SWAN back into deep space. Comet SWAN may be a “hyperbolic comet“–that is, a comet whose orbit has an eccentricity greater than 1. Such comets come from the Oort Cloud or may even be interstellar.

The case for Comet SWAN being a hyperbolic comet is not ironclad. Based on an observation arc of only 3 days, JPL reports the eccentricity of SWAN’s orbit as 1.1 +/- 0.2.  The error bars are still large. The uncertainties will shrink, however, as more observations are added to the database in the nights ahead. Stay tuned for updates.

UPDATE (May 6, 2020): JPL has updated the comet’s eccentricity to 1.00095608 +/- 0.0011254 based on 18 days of data. It is definitely hyperbolic.

A Naked-Eye Outburst from Comet SWAN

May 6, 2020: What just happened to Comet SWAN (C/2020 F8)? The newly-discovered comet surprised observers this week when it suddenly became visible to the unaided eye. “My wife Deborah and I have seen it several times since April 30th,” reports Stephen James O’Meara from Maun, Botswana. “Even the tail is visible with keen averted vision.”

What happened? It might have fragmented, exposing bright clouds of dusty gas to the sun. Certainly the comet’s tail looks like debris from an explosion:

swan_large_cropped

Gerald Rhemann of Farm Tivoli, Namibia, recorded this movie on May 1st using a 12-inch telescope. The footage spans 42 minutes

But Karl Battams of the Naval Research Lab in Washington DC doesn’t think so. “Outbursts do not necessarily imply fragmentation, and ground-based images are not yet showing evidence of a breakup.”

“This could just be a particularly feisty and volatile comet,” he adds, hopefully.

Comet SWAN was discovered on April 11th when Australian amateur astronomer Michael Mattiazzo noticed a curious “bloom” in images from SOHO’s SWAN instrument. SWAN surveys the solar system for hydrogen gas, and it caught the comet making a sudden hydrogen dump. That might have been Comet SWAN’s first outburst.

A second outburst starting in late April turned it into a naked eye object:

lightcurve

Fresh comets often behave this way–cracking, fracturing, and exposing veins of volatile material as they approach the sun for the first time. Comet SWAN is just such an object. It has a hyperbolic orbit, which suggests it has never been here before. Sunlight is touching its surface for the first time with unpredictable results.

More outbursts could be in the offing. Dates of special interest include May 12th when the comet passes by Earth (0.56 AU) and May 27th when the comet slingshots past the sun not far from the orbit of Mercury (0.43 AU).

“It would not surprise me at all to see another outburst – maybe several – in the coming weeks as it closes in on the sun later this month,” says Battams.

Stay tuned!

Observing Tips: To see Comet SWAN, it helps to be in the southern hemisphere. However, that will change in the nights ahead as SWAN moves rapidly northward. This week, observers in the southern USA could get their first glimpse of the comet very low in the eastern sky during morning twilight as it speeds from Cetus into Pisces.  Detailed sky maps are available from Sky&Telescope. Amateur astronomers with GOTO telescopes can use this ephemeris tool to point their optics.

Realtime Comet SWAN Photo Gallery
Free:
Spaceweather.com Newsletter

COVID-19 Skies

May 4, 2020:  Nobody likes a lockdown–except maybe Mother Nature. With many industrialized countries paralyzed by the coronavirus, air pollution has dropped, seismic activity has waned, and wildlife is reclaiming some territory. Frankie Lucena of Puerto Rico points out another effect: “Night skies are darkening,” he says.

Frankie-Lucena-VIIRS_US_1200dpi_1588525494

“I prepared these images to show how the COVID-19 lockdown has dramatically decreased light pollution in the US and in Puerto Rico,” says Lucena.

To investigate the change in light pollution, Lucena accessed nighttime images from the Visible Infrared Imaging Radiometer Suite (VIIRS) on board the Suomi NPP satellite. The instrument’s Day-Night band is excellent at detecting urban lights, moonlit clouds, and auroras. Dramatic changes in urban lighting have clearly happened during the past month as normal commerce and travel have slowed. The data are available here.

Frankie-Lucena-VIIRS_puerto_rico_1200dpi_1588525494

“As a night sky photographer and astronomy enthusiast I embrace this change,” says Lucena, “but I do wish it was under better circumstances.”

Indeed, we at Spaceweather.com join Lucena in hoping for a speedy end to the pandemic. Light pollution is bad, but there are better ways to reduce it.

Comet SWAN is Visible to the Naked Eye

April 30, 2020: Comet SWAN (C/2020 F8) is brightening rapidly. “I just came in from observing it with the naked eye,” reports John Drummond of Gisborne, New Zealand. “It seems to have increased in brightness dramatically since I last saw it a few nights ago.” Indeed, multiple observers have now pegged the comet at magnitude +5.5, just within the range of naked-eye visibility.

At the moment, the comet is little more than a dim fuzzball to the human eye. The view through a telescope, however, is stunning. Gerald Rhemann sends this picture from Farm Tivoli, Namibia:

Gerald-Rhemann-2020F8-27-04_1588020599

“This is a 30 minute exposure through my 12-inch Astrograph,” says Rhemann, who also made a magnificent animation of the comet. In only 40 minutes of tracking, it is possible to see complicated waves and tendrils of gas rippling down the comet’s tail. Play the movie.

The comet’s tail is so long, Rhemann could not fit it in the field of view. “In my photo it measures about 1.2 degrees long,” he says. “However, I know from friends who have photographed wider fields that it actually stretches about 8 degrees across the sky.” For comparison, the bowl of the Big Dipper is 10 degrees wide.

lightcurve

Above: The light curve of Comet SWAN courtesy of the Comet Observation Database (COBS).

Comet SWAN will make its closest approach to Earth on May 12th at a distance of 0.56 AU. That’s not very close, but it could be a good show anyway. If current trends continue, the comet will brighten to 3rd magnitude or better, similar to the stars of the Pleiades. Observers in the southern hemisphere will have little trouble seeing it as it glides through the constellation Pisces.

Much about Comet SWAN remains unknown. It was discovered only a few weeks ago, on April 11th, when a sudden hydrogen dump by the comet made it show up in data from the Solar and Heliospheric Observatory’s SWAN instrument. Comet SWAN’s hyperbolic orbit suggests that it might be a first-time visitor to the inner solar system. Such newcomers are notoriously unpredictable, so no one can say for sure what will happen next. Stay tuned!