A Timeline of Great Aurora Storms

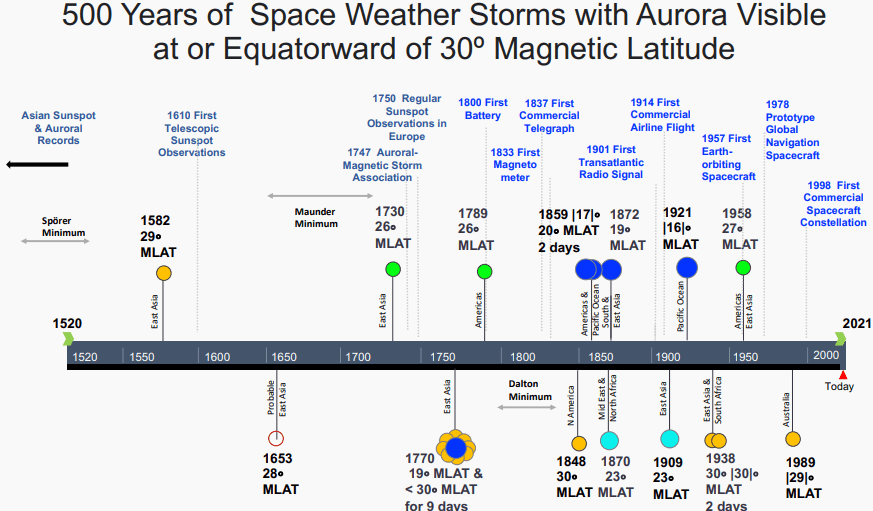
April 30, 2021: Imagine living in Florida. You’ll never see the Northern Lights … right? Actually, the odds may be better than you think. A new historical study just published in the Journal of Space Climate and Space Weather shows that great aurora storms occur every 40 to 60 years.

“They’re happening more often than we thought,” says Delores Knipp of the University of Colorado, the paper’s lead author. “Surveying the past 500 years, we found many extreme storms producing auroras in places like Florida, Cuba and Samoa.”

This kind of historical research is not easy. Hundreds of years ago, most people had never even heard of the aurora borealis. When the lights appeared, they were described as “fog,” “vapors”, “spirits”–almost anything other than “auroras.” Making a timeline 500 years long requires digging through unconventional records such as personal diaries, ship’s logs, local weather reports–often in languages that are foreign to the researchers.

“We defined a ‘Great Storm’ simply as one in which auroras were visible to the unaided eye at or below 30 degrees magnetic latitude,” says Knipp. 

Visual sightings were key. The human eye is a sensor we’ve had in common with observers since the beginning of recorded history. Pre-modern scientists didn’t have satellites or magnetometers to measure solar storms, but they could look up at the night sky. In all, Knipp’s team tallied 14 examples of storms where many people saw auroras within 30 degrees of the equator.

“There may be more,” she notes. “For example, I am aware of a low latitude event that occurred between February and April 1648. It’s not on the timeline, though, because we haven’t yet been able to pin down the date.”

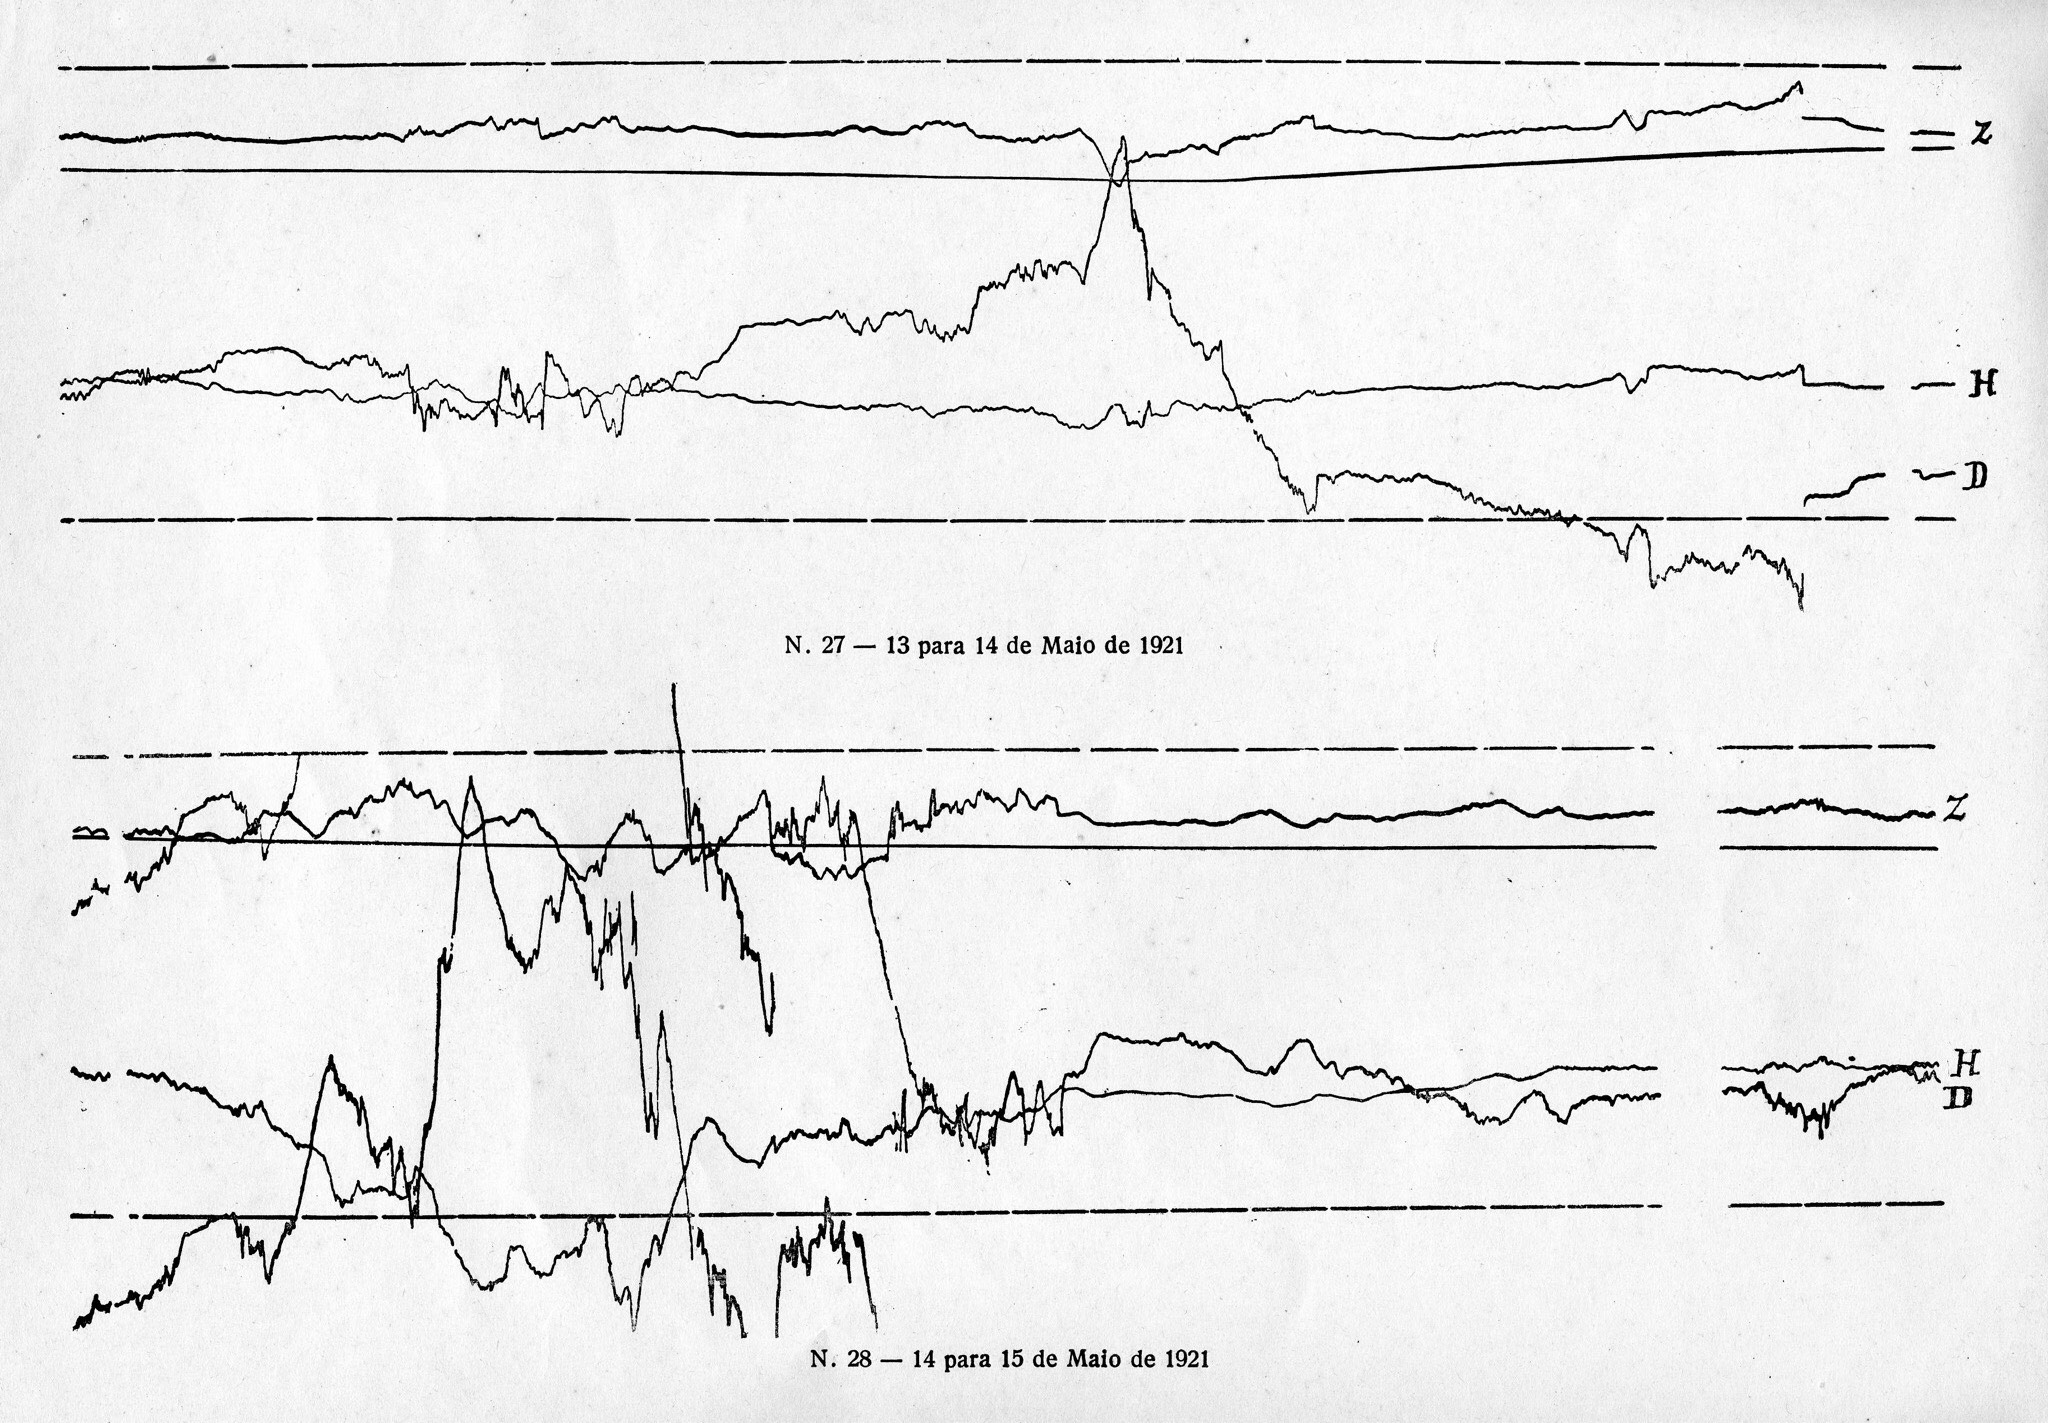
Look at the timeline again; there’s a whole cluster of sightings in Sept. 1770. “The Great Storm of 1770 appears to be a 500-year event,” says Knipp. “There were low-latitude auroras for 9 nights in a row.”

Above: An eyewitness sketch of red auroras over Japan in mid-September 1770. [ref]

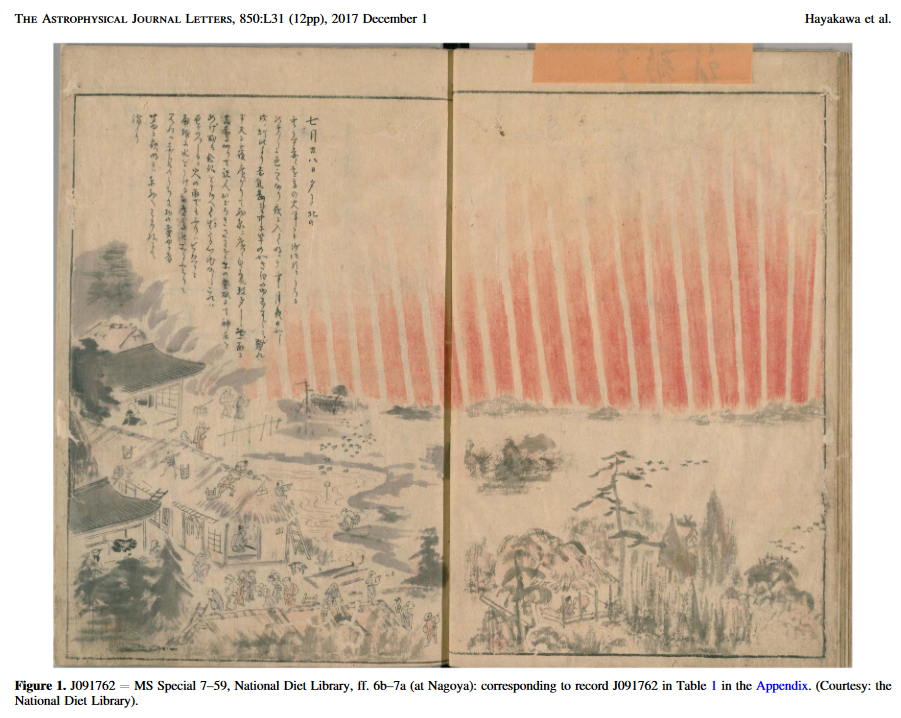
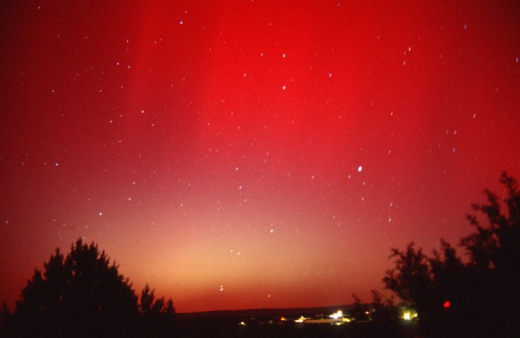
During the 1770 storm, extremely bright red auroras blanketed Japan and parts of China. Captain James Cook himself saw the display from the HMS Endeavour near Timor Island, south of Indonesia. Knipp’s colleague Hisashi Hayakawa (Nagoya University) has found drawings of the instigating sunspot; it is twice the size of the sunspot that caused the infamous Carrington Event of 1859. Knipp’s timeline suggests that this was not “just another Great Storm”; something exceptional happened in 1770 that researchers still don’t fully understand.

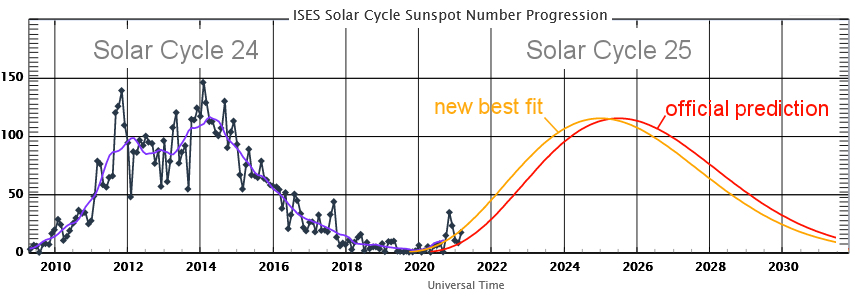
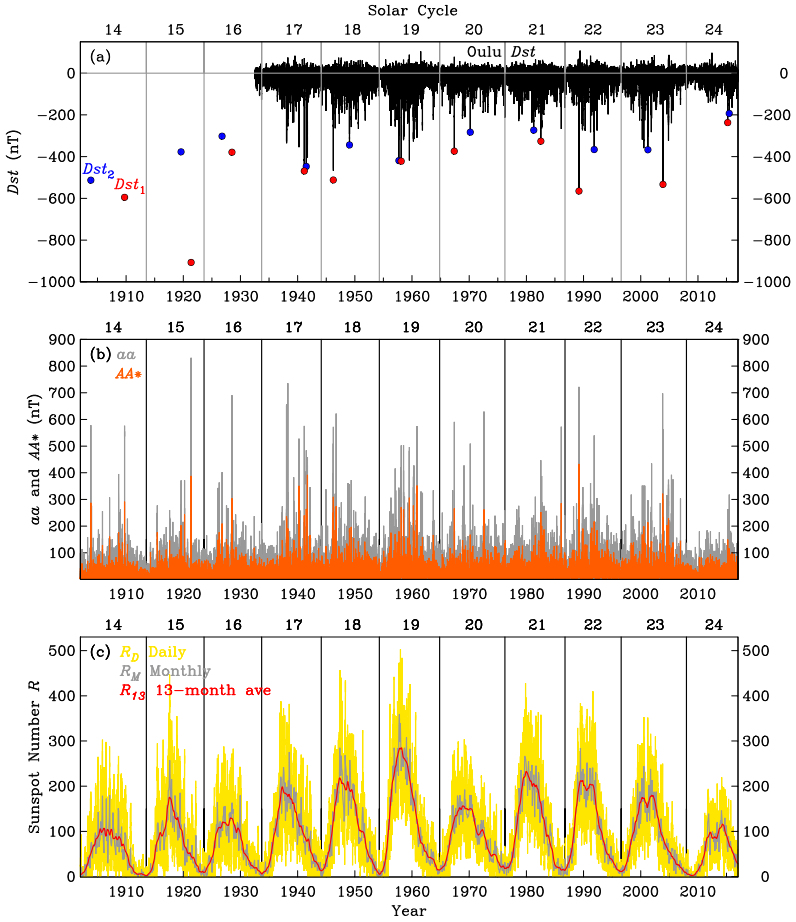
Today’s senior space weather researchers were taught in school that Great Storms are rare. The Carrington Event was long thought to be a singular event, alone in the historical record. Recent studies are finding otherwise. Just last month Jeffrey Love of the US Geological Survey published a paper in the research journal Space Weather showing that extreme geomagnetic storms recur every ~45 years or so–a result in accord with Knipp’s. He used completely different techniques (extreme value statistics and magnetometer records) to reach a similar conclusion. 

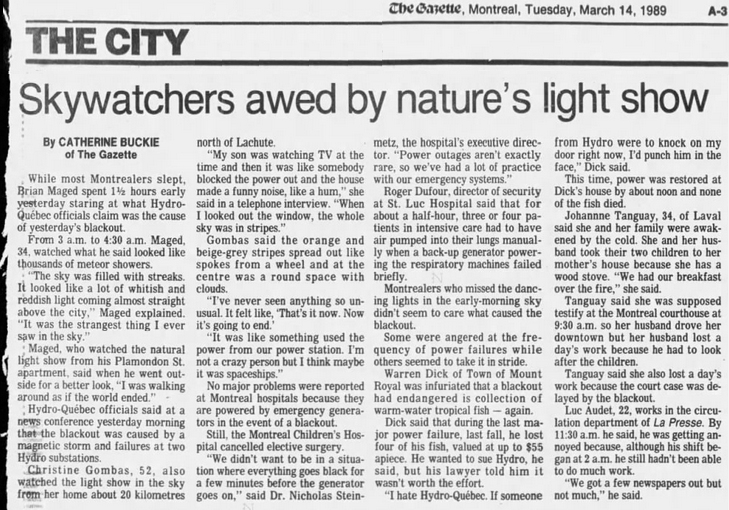
The last Great Storm in Knipp’s timeline occurred 32 years ago. Soon, it will be time for another. Stay tuned.

Solar Tsunami and CME

April 22, 2021: Earth-facing sunspot AR2816 exploded on April 22nd (0435 UT), producing a C3.8-class solar flare. NASA’s Solar Dynamics Observatory recorded a dramatic shock wave rippling away from the blast site:

This is a “solar tsunami.” It is a wave of hot plasma and magnetism, about 100,000 km tall, racing outward at approximately 250 km/s (560,000 mph). Such waves are usually associated with the launch of coronal mass ejections (CMEs)–and indeed, one has been observed.

Coronagraphs onboard the Solar and Heliospheric Observatory (SOHO) detected a CME billowing away from the sun hours after the flare. It is faint but definitely Earth-directed:

The initial velocity of the CME was ~760 km/s. Based on its speed and other factors, NOAA forecasters believe that the CME will reach Earth on April 25th, potentially sparking G2-class geomagnetic storms. Aurora alerts: SMS Text.

Jupiter’s Moons are Eclipsing Each Other

April 21, 2021: Jupiter is about to be edge-on to the sun, and that means unusual things are happening around the giant planet. Here’s an example recorded by Australian astronomer Anthony Wesley on April 19th. “It’s an eclipse of Ganymede by Callisto,” he says.

Above: Anthony Wesley recorded this eclipse using a 16-inch telescope

Callisto is off-screen, stage left, but its circular shadow can be seen moving across the disk of Ganymede. Actually, look again. Just before Callisto’s shadow appears, the shadow of Io partially eclipses Ganymede as well. Wesley captured two of Jupiter’s moons eclipsing a third in only 10 minutes. Unusual, indeed.

In this movie, recorded by Christopher Go using an 11-inch telescope, Io both eclipses and occults Ganymede. See Spaceweather’s Aug. 19, 2009 archive page for details.

This is happening because Jupiter is nearing its equinox on May 2nd; the sun is crossing Jupiter’s equatorial plane. Around this time, the orbits of Jupiter’s moons line up with the sun, allowing their shadows to fall across one another.

Astronomers call it “mutual event season.” During the season, which lasts until August 2021, astronomers can see not only eclipses, but also occultations. That’s when the physical disk of one moon blocks another. The last mutual event season occured in 2015; the next won’t come until 2026.

According to France’s Institute for Celestial Mechanics and Computation of Ephemerides (IMCCE), there are 85 more mutual events between now and the end of the 2021 season. Some of the best may be found in this table from the Cambridge University Press. Only experienced astrophotographers will be able to make movies as detailed as Wesley’s. However, even casual stargazers with ordinary backyard telescopes can see moons winking in and out as the shadowplay unfolds. Look for Jupiter low in the southeast before dawn.

Got a picture? Submit it here.

Solar Flare and Radio Blackout

April 20, 2021: Sunspot AR2816 erupted during the late hours of April 19th (2342 UT), producing a strong M1-class solar flare. NASA’s Solar Dynamics Observatory recorded the extreme ultraviolet flash:

This is one of the strongest flares of young Solar Cycle 25. A pulse of X-rays and ultraviolet radiation from the flare ionized the top of Earth’s atmosphere, causing a shortwave radio blackout over the Pacific Ocean: blackout map. Mariners and ham radio operators in the area might have noticed unusual propagation at frequencies below ~20 MHz.

Interestingly, during the radio blackout the sun generated its own burst of radio noise. Shock waves from the solar flare rippled through the sun’s atmosphere, creating plasma instabilities and natural radio emissions; NOAA reports the detection of Type II and Type IV bursts. These radio bursts may have penetrated the blackout, causing roars of static in the loudspeakers of shortwave radios at the same time that normal terrestrial signals were suppressed. Research shows that solar radio bursts can interfere with the navigation of whales.

The explosion also hurled a coronal mass ejection (CME) into space. In this SOHO coronagraph movie, watch Mercury emerge from behind the occulting disk at about the same time as the CME:

UPDATE: Using these images, NOAA analysts have modeled the CME and determined that it will not hit Earth. Auroraphiles may be disappointed, but here’s some good news: With the increasing pace of solar activity, it’s only a matter of time before the sun sends a CME in our direction. Stay tuned. Aurora alerts: SMS Text.

Solar Cycle Update

April 16, 2021: You probably think Solar Cycle 25 is a dud. Think again. Despite long stretches of spotless quiet, the new solar cycle is actually running ahead of schedule. In this plot, the red curve shows NOAA’s predicted sunspot counts for Solar Cycle 25; the orange curve shows the new best fit:

Above: Observed and predicted sunspot numbers: more

“The sun is performing as we expected–maybe even a little better,” says Lisa Upton of Space Systems Research Corporation. She’s a co-chair of the NOAA/NASA Solar Cycle 25 Prediction Panel. “In 2019, the panel predicted that Solar Cycle 25 would peak in July 2025 (± 8 months) with a maximum sunspot count of 115 ± 10. The current behavior of the sun is consistent with an early onset near the beginning of our predicted range.”

If current trends hold, Solar Cycle 25 could peak as early as 2024, similar in strength to the relatively weak cycle (SC24) that preceded it. Don’t be fooled by the adjective, however. It’s like hurricane season. Even a “weak” season produces hurricanes–and all it takes is one good storm to do a lot of damage.

Above: 10.7cm radio flux, another indicator of solar activity, is also exceeding predictions: more.

“I’m not surprised that people are grumbling about SC25 being a dud,” says Upton. “Weak cycles are typically preceded by long stretches of spotless days, and they are slow to ramp up. All of this is consistent with our prediction.”

Now the waiting begins. As sunspot counts increase over the next year, forecasters will be able to tell if Solar Cycle 25 is *really* following the official prediction or doing something completely different. Predicting the solar cycle is still an infant science, and much uncertainty remains.

Stay tuned.

Sprite Season Begins

April 7, 2021: Spring is the season for sprites, and Paul Smith just photographed a magnificent display over Kansas. “These were my first big sprites of the season,” says Smith, who took this picture on April 6th:

“They were so bright, I saw a couple of them with my unaided eyes,” he adds.

Sprites are a weird form of lightning that leap up from powerful thunderstorms. The ones Smith saw are “jellyfish sprites”, named for their resemblance to sea creatures. Their red tentacles stretch about 90 km high, almost touching the edge of space. Other forms exist, too.

At this time of year, severe storms set the stage for sprite formation. Mesoscale convective systems sweep across the Great Plains, cracking with intense electric fields that drive electrons up and into sprites. La Niña conditions in the Pacific Ocean may amplify this process.

Although the sprites were in Kansas, Smith saw them from Oklahoma. This weather satellite image shows the observing geometry.

“I was about 200 miles away from the thunderstorm,” says Smith. Turns out, that’s about the right distance. You have to be far away to see sprites over the top of the thunderclouds.

Although sprites have been reported by pilots and storm chasers for more than a century, many scientists were skeptical. Can you blame them? “Doctor, I just saw a giant red jellyfish in the sky!” A turning point came in 1989 when sprites were photographed by researchers at the University of Minnesota and cameras onboard the space shuttle. Now sprites are in the mainstream. See for yourself.

Realtime Sprite Photo Gallery
Free:
Spaceweather.com Newsletter

The Chance of Storms Just Doubled

April 8, 2021: If you think you are safe from geomagnetic storms, think again. A new study just published in the journal Space Weather finds that powerful storms may be twice as likely as previously thought.

Jeffrey Love of the US Geological Survey, who authored the study, analyzed Earth’s strongest geomagnetic storms since the early 1900s. Previous studies looked back only to the 1950s. The extra data led to a surprise:

“A storm as intense as, say, the Québec Blackout of 1989 is predicted to occur, on average, about every four solar cycles. This is twice as often as estimated using only the traditional shorter dataset,” says Love.

Above: The data Love used in his extreme value analysis. Red and blue circles denote the two strongest storms in each solar cycle. Dst is a measure of geomagnetic activity that can be estimated from old magnetogram chart recordings.

A study like this is part physics, part math, and part detective work.

Love has spent recent years digging deeply into historical records, trying to figure out how often intense geomagnetic storms occur. It’s tricky. Even when old records of magnetic activity are published, they aren’t always easy to find or interpret. Love recalls the example of Vassouras, Brazil, where important magnetic data were recorded during the Great Geomagnetic Storm of May 1921:

“My colleague, Hisashi Hayakawa, discovered that a copy of the Vassouras yearbook (an annual summary of magnetic data) was held in a Japanese archive maintained by the World Data Center in Kyoto. In that yearbook is a copy of the magnetogram we needed. It is in fragments, upside down, and mislabeled, all of which had to be sorted out. I digitized it myself, and we were able to use the data to estimate the intensity of the 1921 storm.”

Above: A mixed-up fragment of a 1921 magnetogram chart recording from Vassouras, Brazil.

Tricky indeed. Love did similar digging for other storms as far back as Solar Cycle 14, which peaked in 1906. Ultimately, he was able to piece together a list of the most intense events. The top two storms of each solar cycle formed his dataset.

Then the statistics began. The methods Love used are not new, per se, but they are new to the field of space weather. Love explains: “Extreme-value statistical methods were developed by statisticians in the 1920s to 1940s. From there, it took a while for the methods to be distilled down and presented in an approachable way for non-statisticians. They are really only now starting to be used in the space weather community.”

Above: The morning after–a March 14, 1989, report of the Great Quebec Blackout in Montreal’s newspaper, the Gazette. [more]

An important result of Love’s research is the odds of another Québec-class storm: On March 13, 1989, a coronal mass ejection (CME) slammed into Earth’s magnetic field. It hit with unusual force, because a previous CME had cleared a path for it. Within 90 seconds of impact, the Hydro-Québec power grid failed, plunging millions of Canadians into darkness.

As the geomagnetic storm intensified, bright auroras spread as far south as Florida, Texas, and Cuba. Some onlookers thought they were witnessing a nuclear exchange. Decades later, power grid operators are still figuring out how to protect their systems from a repeat calamity.

Québec was once thought to be a 100 year storm. Extreme value statistics suggest a different answer. “It’s more like 45 years,” says Love.

In other words, the chance of storms just doubled.

Love’s original research, entitled “Extreme-event magnetic storm probabilities derived from rank statistics of historical Dst intensities for solar cycles 14-24,” may be read here.

20 Years Ago, An Extreme Geomagnetic Storm

March 31, 2021: What a difference 20 years makes. Today the sun is blank and featureless as Solar Cycle 25 struggles pull solar activity from the doldrums of a deep Solar Minimum. In March 2001, however, the solar disk was peppered with sunspots, including a monster named “AR9393.” The biggest sunspot of Solar Cycle 23, AR9393 was a truly impressive sight, visible to the naked eye at sunset and crackling with X-class solar flares.

On March 29, 2001, AR9393 hurled a pair of CMEs directly toward Earth. The first one struck during the early hours of March 31, 2001. The leading edge of the shock front was dense (~150 protons/cc) and strongly magnetized — traits that give rise to powerful geomagnetic disturbances. Within hours, an extreme geomagnetic storm was underway, registering the maximum value of G5 on NOAA storm scales.

“I was fortunate to witness and photograph the event when I was just a teenager,” recalls Lukasz Gornisiewicz, who watched the show from Medicine Hat, Alberta:

In the hours that followed, Northern Lights spread as far south as Mexico. In 20 year old notes, Dr. Tony Phillips of Spaceweather.com describes “red and green auroras dancing for hours” over the Sierra Nevada mountains of California at latitude +37 degrees. Similar displays were seen in Houston, Texas; Denver Colorado; and San Diego, California.

“Here in Payson, Arizona, red curtains and green streamers were pulsating all across the sky,” wrote Dawn Schur when she submitted this picture to Spaceweather.com 20 years ago:

“We have seen some auroras here before, but this display was really special,” she wrote.

A second CME struck at ~2200 UT on March 31th. Instead of firing up the storm, however, the impact quenched it. When the CME passed Earth the interplanetary magnetic field surrounding our planet suddenly turned north — an unfavorable direction for geomagnetic activity.

Indeed, the quenching action of the second CME may have saved power grids and other technological systems from damage. The storm’s intensity (-Dst=367 nT) stopped just short of the famous March 14, 1989, event that caused the Quebec Blackout (-Dst=565 nT) and it was only a fraction of the powerful Carrington Event of 1859 (-Dst=~900 nT).

The whole episode lasted barely 24 hours, brief but intense. Visit Spaceweather.com archives for March 30, 31st and April 1, 2001, to re-live the event. Our photo gallery from 20 years ago is a must-see; almost all the pictures were taken on film!

March 30-31, 2001, Aurora Photo Gallery
Free:
Spaceweather.com Newsletter