Introducing the Thermosphere Climate Index

Oct. 26, 2018: The Thermosphere Climate Index (TCI) is now on Spaceweather.com. TCI is a relatively new space weather metric that tells us how the top of Earth’s atmosphere (or “thermosphere”) is responding to solar activity. During Solar Max the top of our atmosphere heats up and expands. Right now the opposite is happening. Solar minimum is here and the thermosphere is cooling off:

TCI_Daily_NO_Power_Percentiles_26oct18_yah2

TCI was invented by Martin Mlynczak of NASA’s Langley Research Center and colleagues. For the past 17 years they have been using the SABER instrument onboard NASA’s TIMED satellite to monitor the wattage of infrared emissions from the top of the atmosphere. Recently, they realized that these measurements could be used to summarize the state of the thermosphere in a single daily number–the TCI.  Moreover, they learned to calculate TCI going back in time all the way to the 1940s, thus placing current conditions in a historical context.

So where do we stand? Right now TCI=4.6×10¹⁰ W. That means the top of Earth’s atmosphere is approximately 10 times cooler than it was during the record-setting Solar Max of 1957-58 (TCI=49.4×10¹⁰ W). The record low value for TCI, 2.1×10¹⁰ W, was set during the Solar Minimum of 2009. It’s still not that cold in the thermosphere, although we’re getting close.

You can monitor daily values of TCI on SpaceWeather.com. It’s located here:

righthere

Not only does the number track the slow progression of the 11-year solar cycle, but also it can change suddenly in response to solar flares and geomagnetic storms. As these events occur, we’ll be writing about them to raise awareness of the many ways the sun can dump energy into Earth’s atmosphere.

Finally, please be aware that the thermosphere is very far above our heads–more than 100 km high. Just because the rarefied air up there is cooling off, it doesn’t mean the surface of the Earth is getting colder. Not yet, at least. Stay tuned for updates as the solar cycle progresses.

Atmospheric Radiation Increasing from Coast to Coast in the USA

Oct. 24, 2018: So you thought Solar Minimum was boring? Think again. High-altitude balloon flights conducted by Spaceweather.com and Earth to Sky Calculus show that atmospheric radiation is intensifying from coast to coast over the USA–an ironic result of low solar activity. Take a look at the data:

atmospheric_radiation2

Above: Radiation dose rates at the Regener-Pfotzer Maximum, ~65,000 ft high at the entrance to the stratosphere.

Since 2015, we have been monitoring X-rays, gamma-rays and neutrons in the stratosphere–mainly over central California, but also in a dozen other states (NV, OR, WA, ID, WY, KS, NE, MO, IL, ME, NH, VT). Everywhere we have been there is an upward trend in radiation–ranging from +20% in central California to +33% in Maine. The latest points, circled in red, were gathered during a ballooning campaign in August-October 2018.

How does Solar Minimum boost radiation? The answer lies in the yin-yang relationship between cosmic rays and solar activity. Cosmic rays are the subatomic debris of exploding stars and other violent events. They come at us from all directions, 24/7. Normally, the sun’s magnetic field and solar wind hold cosmic rays at bay–but during Solar Minimum these defenses weaken. Deep-space radiation surges into the solar system.

sunspotnumbers_oct2018

Cosmic rays crashing into our planet’s atmosphere produce a spray of secondary particles and photons. That secondary spray is what we measure. Each balloon flight, which typically reaches an altitude greater than 100,00o feet, gives us a complete profile of radiation from ground level to the stratosphere. Our sensors sample energies between 10 keV and 20 MeV, spanning the range of medical X-ray machines, airport security devices, and “killer electrons” in Earth’s radiation belts.

Who cares? For starters, anyone who flies. Cosmic radiation at aviation altitudes is typically 50 times that of natural sources at sea level. Pilots are classified as occupational radiation workers by the International Commission on Radiological Protection (ICRP) and, according to a recent study from researchers at the Harvard School of Public Health, flight attendants face an elevated risk of cancer compared to members of the general population. They listed cosmic rays as one of several risk factors. Weather and climate may also be affected, with some research linking cosmic rays to to the formation of clouds and lightning. Finally, there are studies (one recently published in Nature) asserting that heart rate variability and cardiac arrhythmias are affected by cosmic rays in some populations. If true, it means the effects reach all the way to the ground.

As 2018 comes to an end, Solar Minimum appears to be just getting started. Cosmic rays could continue to increase for years to come, so stay tuned.

Realtime Space Weather Photo Gallery

Inferior Conjunction of Venus

Oct. 22, 2018: On Oct. 26th, Venus will pass almost directly between Earth and the sun–an event astronomers call “inferior solar conjunction.” As Venus approaches the sun, the planet is turning its night side toward Earth, reducing its luminous glow to a thin sliver. Shahrin Ahmad of Kuala Lumpur, Malaysia, took this picture on Oct. 19th:

“I took this picture in broad daylight,” says Ahmad. “Venus was really big in the eyepiece of my telescope–almost a full arcminute in diameter. And the crescent shape was easily visible in the 8×50 finder scope.”

In the days ahead, the crescent of Venus will become increasingly thin and circular. The horns of the crescent might actually touch when the Venus-sun angle is least (~6 degrees) on Oct. 26th. This is arguably the most beautiful time to observe Venus, but also the most perilous. The glare of the nearby sun magnified by a telescope can damage the eyes of anyone looking through the eyepiece.

Anthony J. Cook of the Griffith Observatory has some advice for observers: “I have observed Venus at conjunction, but only from within the shadow of a building, or by adding a mask to the front end of the telescope to fully shadow the optics from direct sunlight. This is tricky with a refractor or a catadioptric, because the optics start at the front end of the tube. Here at Griffith Observatory, I rotate the telescope dome to make sure the lens of the telescope is shaded from direct sunlight, even through it means that the lens will be partially blocked when aimed at Venus. With our Newtonian telescope, I add a curved cardboard mask at the front end of the tube to shadow the primary mirror.”

Earlier today, Richard Nugent of Framingham, Massachusetts, used a 10-inch telescope (masked down to 60 mm) and an iPhone 8Plus to photograph Venus in broad daylight:

“Venus is 1.3% illuminated and only 9°20′ from the sun!” says Nugent.

Realtime Venus Photo Gallery

The Orionid Meteor Shower

Oct. 19, 2018: Right now, specks of dust from Halley’s Comet are disintegrating in Earth’s atmosphere, kicking off the annual Orionid meteor shower. NASA cameras caught more than a dozen Orionid fireballs streaking across the USA during the past 48 hours, and the show is expected to improve during the weekend as Earth moves deeper into Halley’s stream of debris:

fireball_strip2

Above: This Orionid fireball, observed by Maciek Myszkiewicz in Oct. 2012, was as bright as a full Moon.

“The upcoming Orionids should provide a fairly good show for most visual observers,” says Peter Brown of the University of Western Ontario Meter Physics Group. “The shower’s radiant is already quite active and well defined in data from the Canadian Meteor Orbit Radar (CMOR).”

Orionids appear every year around this time when Earth crosses Halley’s debris stream, with the shower typically producing about 20 meteors per hour. Some of the brightest stars and constellations in the sky–e.g., Orion the Hunter, Sirius the Dog Star, and Taurus the Bull–form the shower’s backdrop. This makes the display extra-beautiful in disproportion to the raw number of meteors.

Some years, however, are even better than others. “Most notable was a short-lived outburst of relatively bright Orionids in 1993 observed several days before the predicted peak. This hints that there may be narrow filaments of larger meteoroids embedded in the overall debris stream,” says Brown. “We also observed enhanced Orionid activity in the years 2006 through 2009 with rates 2 to 3 times normal.”

This year’s shower has one thing going against it: The nearly full Moon. Lunar glare could reduce visible meteor rates 2- or 3-fold. The best time to look, therefore, is during the dark hours before sunrise when the Moon is sinking below the western horizon and the shower’s radiant in Orion is high in the southeast: sky map.

“Finding dark skies and clear weather in the early morning hours of Sunday, Oct 21st, just after the moon sets this year is the surest way to see these messengers from 1P/Halley,” says Brown. Enjoy the show!

Realtime Meteor Photo Gallery


Geomagnetic Thunder? Auroras Caught Making Noise

Oct. 10, 2018: On Oct. 7th, a solar wind stream hit Earth’s magnetic field, sparking a G1-class geomagnetic storm. In southern Finland, the night sky turned green as energetic particles rained down on the upper atmosphere. But there was more to the show than beautiful lights.

“The storm also produced a number of distinctive sounds including crackles and claps,” reports Prof. Emeritus Unto K. Laine of Finland’s Aalto University. “Here is a recording of one of the strongest sounds of the night–a sharp clap.” Click to listen:

“I recorded this in the vicinity of Fiskars village after midnight local time,” he says.

Auroral sounds are controversial. Over the centuries, there have been many reports of strange sounds under the Northern Lights. However, researchers have struggled to explain the phenomenon and sometimes suggested that they might be imaginary. Laine is a believer: “We have been recording sounds like these for almost 20 years as part of the Auroral Acoustics Project.” More samples may be found here.

Laine has developed arrays of microphones that can pinpoint the sounds through triangulation. He finds that they occur about 70 meters above the ground. Temperature inversion layers at that altitude can cause a separation of + and – charges in the air. During some geomagnetic storms, the charge separation breaks down, causing air to move and a faint “clap” to be heard.

Think of it as geomagnetic thunder.

A spectral analysis of the “thunderclap” (above) shows dominant frequencies between 1 kHz and 2 kHz, squarely in the range of human hearing. You have to be quiet to hear them, though.

“People who talk and walk around, concentrating on picture taking, might never hear a single sound related to aurora,” says Laine. “You have to stop all other activities and focus on listening. We Finns are probably good at this because we have received more than 300 reports of sound observations during the Auroral Acoustics Project.”

Over the years, Laine has learned that a geomagnetic storm, by itself, is not enough to produce these thunderclaps. “A strong inversion layer is also required,” he says. “The inversion layer acts like an electrostatic loudspeaker. Without it there are no sounds.” This explains why many geomagnetic storms are silent. The local weather has to be just right — as it was on Oct. 7th.

Realtime Aurora Photo Gallery

Earth Dodges a Meteor Storm

Oct. 13, 2018: On Oct. 8-9, Europeans outdoors around midnight were amazed when a flurry of faint meteors filled the sky. “It was a strong outburst of the annual Draconid meteor shower,” reports Jure Atanackov, a member of the International Meteor Organization who witnessed the display from Slovenia. Between 22:00 UT (Oct. 8) and 01:00 UT (Oct. 9), dark-sky meteor rates exceeded 100 per hour. In eastern France, Tioga Gulon saw “1 to 2 meteors per minute,” many of them shown here in an image stacked with frames from his video camera:

“It was a rare and impressive event,” says Atanackov.

It could easily have been 10 times more impressive. In fact, Earth narrowly dodged a meteor storm.

The European outburst occurred as Earth skirted a filament of debris from Comet 21P/Giacobini-Zinner. If that filament had shifted in our direction by a mere 0.005 AU (~500,000 miles), Earth would have experienced a worldwide storm of 1000+ meteors per hour. These conclusions are based on a computer model of the comet’s debris field from the University of Western Ontario’s Meteor Physics Group. Here it is, showing Earth shooting the gap between two filaments of comet dust:

Western Ontario postdoctoral researcher Auriane Egal created the model and predicted the outburst before it happened. Egal’s model was in good agreement with a rival model from NASA, so confidence was high. Meteors seen over Europe came from the larger filament on the right.

According to the models, Earth’s L1 and L2 Lagrange points were both forecast to have storm-level activity–especially L2 which would experience the Earth-equivalent of 4000+ meteors per hour. This prompted NASA to take a close look at the danger to spacecraft.

“The US has four space weather spacecraft at L1: ACE, SOHO, Wind, and DSCOVR,” says Bill Cooke of NASA’s Meteoroid Environment Office. “There is only one operational spacecraft at L2 – the European Space Agency’s GAIA – which was where most of the Draconid activity was expected to take place. GAIA shut down science operations for a few hours around the projected storm peak and re-oriented to turn the hard side of the vehicle towards the incoming debris. All of the spacecraft came through the Draconids without incident, and this shower provided a good test of our ability to forecast meteor activity outside of Earth orbit.”

Many readers have wondered if the outburst has anything to do with Comet 21P/Giacobini-Zinner’s close approach to Earth last month. “No,” says Cooke.  “The models show the outburst experienced at Earth was mainly caused by material ejected from the comet from 1945 to the mid 1960’s. The meteoroids were more than half a century old.”

Realtime Meteor Photo Gallery

Rads on a Plane: New Results

Oct. 3, 2018: Many people think that only astronauts need to worry about cosmic radiation. Not so. Ordinary air travelers are exposed to cosmic rays, too. A recent study from researchers at Harvard found that flight attendants have a higher risk of cancer than members of the general population, and the International Commission on Radiological Protection has classified pilots as occupational radiation workers.

How much radiation do you absorb? SSpaceweather.com and the students of Earth to Sky Calculus have been working to answer this question by taking cosmic ray detectors onboard commercial airplanes. Flying since 2015, we have collected more than 22,000 GPS-tagged radiation measurements over 27 countries, 5 continents, and 2 oceans.

maps

(A) A global overview of our flights. This map shows where we have been. (B) To show the density of our data, we zoom in to the Four Corners region of the USA. There are three major hubs in the map: Phoenix, Las Vegas, and Denver. You can’t see them, however, because they are overwritten by pushpins.

Here is what we have learned so far:

  1. Radiation always increases with altitude, with dose rates doubling every 5000 to 6000 feet. This make sense: The closer you get to space, the more cosmic rays you will absorb.
  2. At typical cruising altitudes, cosmic radiation is 40 to 60 times greater than natural sources at sea level.
  3. Passengers on cross-country flights across the USA typically absorb a whole body dose equal to 1 or 2 dental X-rays.
  4. On international flights, the total dose can increase ~five-fold with passengers racking up 5 to 6 dental X-rays.

Using our database, we can investigate patterns of radiation around the world. For instance, this plot compares aviation radiation over the tropics vs. the Arctic:

arctic_tropics

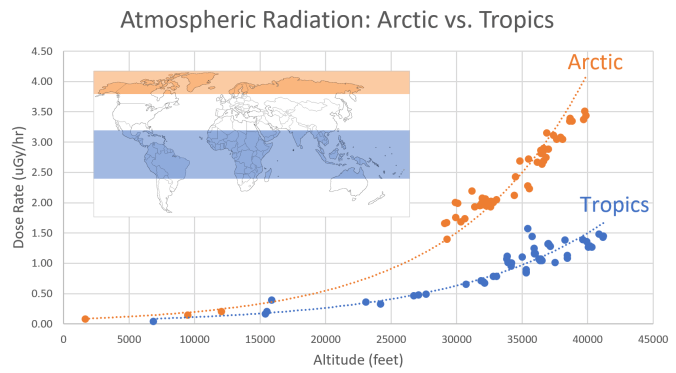
We see that the Arctic is a high radiation zone. This comes as no surprise. Researchers have long known that particles from space easily penetrate Earth’s magnetic field near the poles, while the equator offers greater resistance. That’s why auroras are in Sweden instead of Mexico. Generally speaking, passengers flying international routes over the poles absorb 2 to 3 times more radiation than passengers at lower latitudes.

We can also look at individual countries–e.g., Sweden vs. the USA vs. Chile:

countries

As an Arctic country, Sweden has the most radiation–no surprise. The continental USA straddles the middle–again, no surprise. A mid-latitude country can be expected to have middling radiation. Chile, however, is more of a puzzle.

Although Chile does not cross the equator, it has some of the lowest readings in our database. This phenomenon is almost certainly linked to Chile’s location on the verge of the South Atlantic Anomaly–a distortion in Earth’s magnetic field that affects radiation levels. We are actively investigating the situation in Chile with additional flights, and will report results in a future blog.

Because our home base is in the USA, we spend a lot of time flying there. The US dataset is so dense, we can investigate regional differences across the country–for example, New England vs. the Southwest:

newengland_southwest

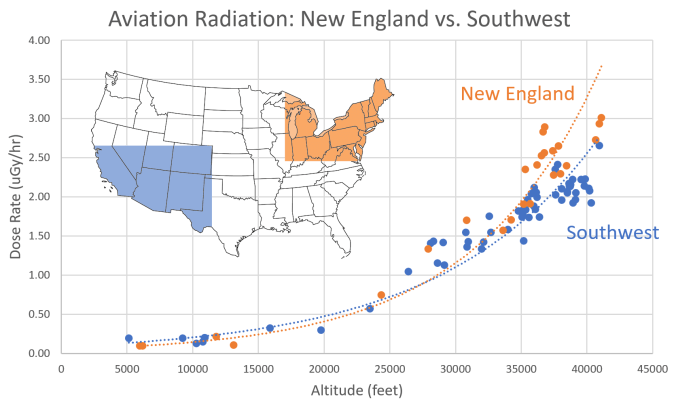
The two curves are indistinguishable below ~30,000 feet, but at higher altitudes they diverge. By the time a plane reaches 40,000 feet, it would experience 30% more radiation over New England than the same plane flying above the desert Southwest. According to our measurements so far, New England is the “hottest” region of the continental USA, radiation-wise, with the Pacific Northwest a close second.

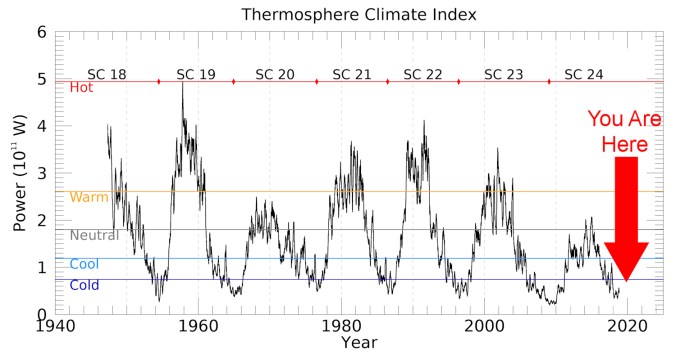
Perhaps the most important outcome of our work so far is E-RAD–a new predictive model of aviation radiation. We can now predict dose rates on flights in areas where we have flown before. Because it is constantly updated with new data, E-RAD naturally keeps up with variables that affect cosmic rays such as the solar cycle and changes in Earth’s magnetic field.

Here is an example of a recent flight we took from Baltimore to Las Vegas, comparing E-RAD’s predictions with actual measurements:

eradvreality

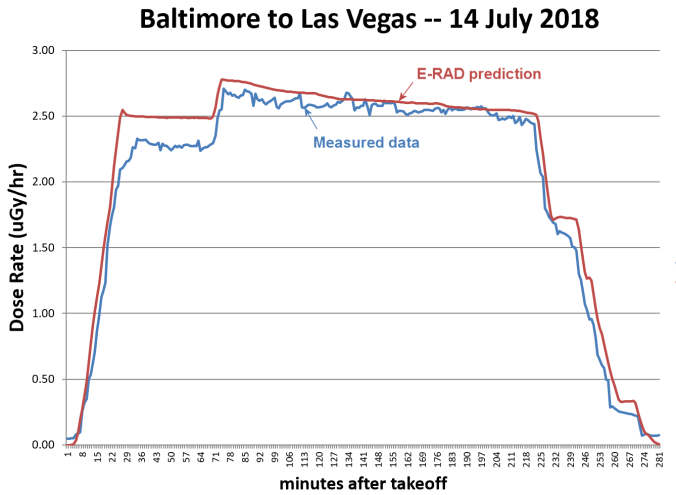
The two agree within 10% for most of the flight. These errors are constantly shrinking as we add new readings to our database.

The results in this report are offered as a preview of what we are learning. Our database is growing almost-daily with new flights to new places, and we will have more results to share in the weeks ahead. We’ve created a website to showcase what we are learning and ultimately to let you, the reader, interact with our databases as well: RadsonaPlane.com.

Visit RadsonaPlane.com