A Cannibal CME is Approaching Earth

March 29, 2022: On March 28th, sunspot AR2975 unleashed a frenzy of solar flares–more than 17 in all. There were 11 C-class flares and 6 M-flares. At least two full-halo CMEs emerged from the chaos:

Above: A SOHO coronagraph movie of multiple CMEs on March 28, 2022.

The first CME in this movie was produced by an M4-class flare at 1129 UT. It departed the sun traveling 1259 km/s. The second CME was produced by an M1-class flare at 1923 UT. It departed even faster, traveling ~1700 km/s.

A NOAA computer model suggests that the second CME will overtake the first, merging into a single “Cannibal CME” before striking Earth’s magnetic field around 0300 UT on March 31st.

Cannibal CMEs are fast coronal mass ejections that sweep up slower CMEs in front of them. This NASA movie shows what happens. The mish-mash contains tangled magnetic fields and compressed plasmas that can spark strong geomagnetic storms.

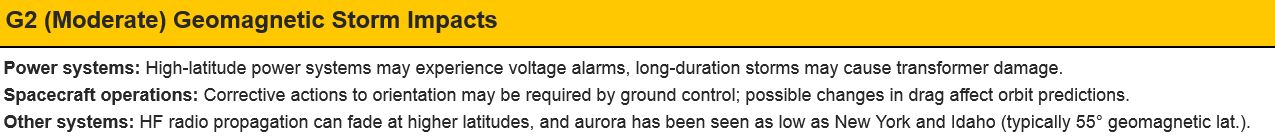
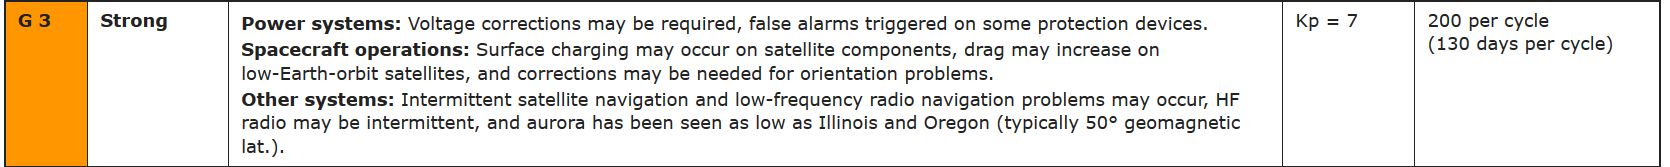
If the NOAA model is correct, the density of solar wind plasma around Earth could increase 10-fold when the CME arrives, while the solar wind speed will top 700 km/s. These events would set the stage for G2– to G3-class geomagnetic storms.

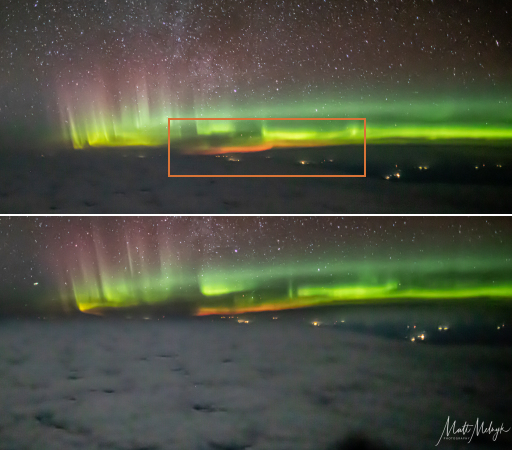
Observing tips: North Americans should be alert for auroras after local nightfall on March 30th. For Europeans, the hours before dawn on March 31st are favored. When chasing auroras, dark skies are essential; go to the countryside. Urban glare can overwhelm auroras even during a strong geomagnetc storm. Aurora alerts: SMS Text.

The Thermosphere is Warming Up

March 23, 2022: Solar Cycle 25 is intensifying–and Earth’s upper atmosphere is responding.

“The Thermosphere Climate Index (TCI) is going up rapidly right now,” reports Linda Hunt of Science Systems and Applications, Inc. “It has nearly tripled in the past year.”

TCI is a number published daily by NASA, which tells us how hot Earth’s upper atmosphere is. The thermosphere, the very highest layer of our atmosphere, literally touches space and is a sort of “first responder” to solar activity. Hunt created this plot showing how TCI has unfolded during the last 7 solar cycles.  Solar Cycle 25 (shown in blue) is just getting started:

“So far Solar Cycle 25 is well ahead of the pace of Solar Cycle 24,” notes Hunt. If this trend continues, the thermosphere could soon hit a 20-year high in temperature.

Before we go any farther, a word of caution: This does not mean Earth itself is about to heat up. The thermosphere is hundreds of kilometers above our heads. Here on the planet’s surface we do not feel its heat; summer days are no warmer when TCI is “hot.” As Dr. Marty Mlynczak of NASA notes, “energy driving the climate system near Earth’s surface is hundreds of thousands of times greater than in the thermosphere.” As far as we know, cyclical warming and cooling of the thermosphere by the solar cycle does not affect climate.

Nevertheless, the thermosphere is important. When it heats up, as it is doing now, it also puffs up. Think of a marshmallow held over a campfire. The thermosphere can expand upward so much it actually touches Earth-orbiting satellites. Almost 40 Starlink satellites fell out of the sky earlier this year as a result of aerodynamic drag up there.

Above: Layers of the atmosphere. Credit: NASA

TCI might also have some predictive value. Hunt’s plot shows that the index is on an upward trajectory that most closely mimics Solar Cycle 20, which peaked back in the 1970s. Coincidentally, a new prediction for Solar Cycle 25 based on the arrival of the Termination Event suggests the same thing: It could look a lot like Solar Cycle 20–an above-average cycle with plenty of solar activity.

You can follow the progress of TCI as Solar Cycle 25 unfolds. It is published every day right here on Spaceweather.com.

What is TCI?

TCI is the “Thermosphere Climate Index”, a number NASA publishes every day to keep track of the temperature at the top of Earth’s atmosphere–a layer of gas researchers call “the thermosphere.”

layers

“The thermosphere always cools off during Solar Minimum–and it warms up again during Solar Maximum,” explains Martin Mlynczak of NASA’s Langley Research Center. “It’s one of the most important ways the solar cycle affects our planet.”

When the thermosphere warms, it expands, literally increasing the radius of Earth’s atmosphere. This expansion increases aerodynamic drag on satellites in low-Earth orbit, which can bring them down prematurely. When the thermosphere cools, it shrinks; satellites get a reprieve.

Mlynczak and colleagues recently introduced the “Thermosphere Climate Index” (TCI)–a number expressed in Watts that tells how much heat nitrogen oxide (NO) molecules in the thermosphere are dumping into space. During Solar Maximum, TCI is high (“Hot”); during Solar Minimum, it is low (“Cold”).

tci

Above: An historical record of the Thermosphere Climate Index. Mlynczak and colleagues recently published a paper on the TCI showing that the state of the thermosphere can be discussed using a set of five plain language terms: Cold, Cool, Neutral, Warm, and Hot.

TCI is based on measurements from the SABER instrument onboard NASA’s TIMED satellite. SABER monitors infrared emissions from carbon dioxide (CO2) and nitric oxide (NO), two substances that play a key role in the energy balance of air 100 to 300 kilometers above our planet’s surface. By measuring the infrared glow of these molecules, SABER can assess the thermal state of gas up there.

Although SABER has been in orbit for only 17 years, Mlynczak and colleagues recently calculated TCI going all the way back to the 1940s. “SABER taught us to do this by revealing how TCI depends on other variables such as geomagnetic activity and the sun’s UV output–things that have been measured for decades,” he explains.

CME Wipes Out Cosmic Rays

March 17, 2022: The March 13th CME did more than spark bright auroras. It also wiped out a lot of cosmic rays. Neutron monitors at the Sodankyla Geophysical Observatory in Oulu, Finland, recorded a sharp drop in cosmic radiation just after the CME arrived:

This is called a “Forbush decrease,” named after American physicist Scott Forbush who studied cosmic rays in the early 20th century.  It happens when a coronal mass ejection (CME) sweeps past Earth and pushes galactic cosmic rays away from our planet. Radiation from deep space that would normally pepper Earth’s upper atmosphere is briefly wiped out.

There’s something odd about this Forbush decrease. It’s a double dip decrease. Cosmic rays dropped precipitously on March 13th–then they surged midday on March 14th–then they dropped precipitously again. The up-and-down may be a sign of structure inside the CME.

As Solar Cycle 25 intensifies, more and more CMEs will sweep past Earth. Forbush decreases will become increasingly common and may even begin to overlap. This will cause a persistent decline in cosmic rays around our planet.

A recent paper in the Astrophysical Journal looked at the last two solar cycles and compared the daily rate of CMEs to the strength of cosmic rays. The plot, above, shows the results. At the peak of Solar Cycle 24, the sun was spitting out more than 5 CMEs per day; at the same time, galactic cosmic rays (GCRs) dropped more than 60%.

Evidence is mounting that new Solar Cycle 25 will be stronger than Solar Cycle 24. If so, CMEs will be more abundant and cosmic rays even more depressed–a welcome reduction for astronauts, air travelers, and even some mountain climbers.

Meanwhile, the March 13th Forbush decrease is still underway. Cosmic rays remain depressed 4 full days after the CME arrived.

The Mystery of Orange Auroras

March 4, 2022: A recent display of auroras over Canada has experts scratching their heads. The mystery? They were orange. Pilot Matt Melnyk was flying 36,000 feet over Canada on Feb. 23rd when he saw the strangely-colored lights from the cockpit window:

“I have been chasing and photographing auroras for more than 13 years (often from airplanes) and this is the first time I have ever seen orange,” says Melnyk.

What’s so strange about orange? Joe Minow of NASA’s Marshall Space Flight Center explains: “Theoretically, nitrogen and oxygen (N2, N2+, and O2+) can produce emissions at orange wavelengths, but these are typically weak compared to stronger emissions from the same molecules at the red end of the spectrum. It is hard to understand how orange could dominate in an auroral display.”

Even so, Melnyk says “these appeared to be real auroras.” The orange fringe danced in sync with regular red and green auroras overhead. It did not appear to be an artifact of city lights or distant twilight. Moreover, Melnyk saw the orange color with his naked eye, and his camera recorded it, too.

Above: The red pushpin marks the approximate location of the plane on Feb. 23rd (22:48 EST) when the orange auroras appeared. Inset is the camera’s view.

Kjellmar Oksavik, a space physicist at the University Center in Svalbard (UNIS), has an idea: “Normally, auroras are produced by electrons with energies less than 10 keV. Raining down from space, they stop an an altitude of 100 km where the dominant color is green (caused by electrons hitting oxygen). During strong activity, however, electrons can reach energies of 20 keV and even higher. These electrons penetrate deeper, all the way down to 80-100 km. Here nitrogen molecules dominate, with multiple emission lines in blue, purple, orange, red and magenta.”

“I think this is what is happening in the picture,” says Oksavik. “On this particular day the precipitating electrons were so energized that they reached deeper into the atmosphere (probably 80-90 km) where nitrogen molecules emitted a wide range of colors, that combines into what looks like an orange glow.”

Oksavik’s colleague Fred Sigernes, chief of the UNIS Aurora Observatory, agrees with Oksavik, but also wonders “why have we never observed this up here with our cameras in Svalbard?” It’s a mystery, indeed.

Have you observed orange auroras? Submit your photos here.