Solar Max is Boosting Airglow

June 26, 2023: There was no geomagnetic storm on June 22nd. Nevertheless, the sky turned green over rural Colorado. Aaron Watson photographed the dramatic display from the West Elk Mountains:

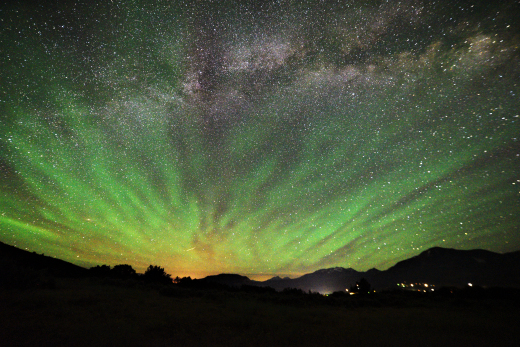
“I woke up around midnight to crystal clear skies,” says Watson. “I noticed some wispy rays and, at first, I thought maybe it was noctilucent clouds. Upon closer inspection there was an intense green glow rippling across the entire sky.”

Although this looks a lot like aurora borealis, it is something completely different: airglow. Cameras with nighttime exposure settings can pick up the faint emission from anywhere on Earth even when geomagnetic activity is low. All that’s required is a very dark sky.

“Airglow is produced by photochemistry in Earth’s upper atmosphere,” says space scientist Scott Bailey of Virginia Tech. “And it is very interesting photochemistry.”

He explains: There is a layer of air about 95 km above Earth’s surface where two forms of oxygen mix together: Molecular oxygen (O2, the kind of oxygen we breathe) and atomic oxygen (O, a reactive species that is toxic to people). Both species are abundant in a wafer-thin zone only 10 km deep. O2 collides with O, exciting the atoms, which later relax by emitting green photons.

“I photographed it, too!” reports Christie Allen, who lives in southern Colorado. “Green rays were emerging from the Sangre de Cristo mountain range to our east.”

“At first I thought they were auroras,” she says, “but now I know it was airglow.”

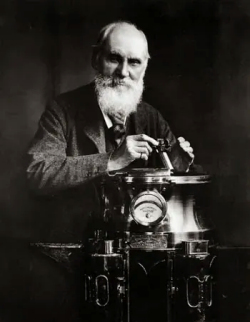
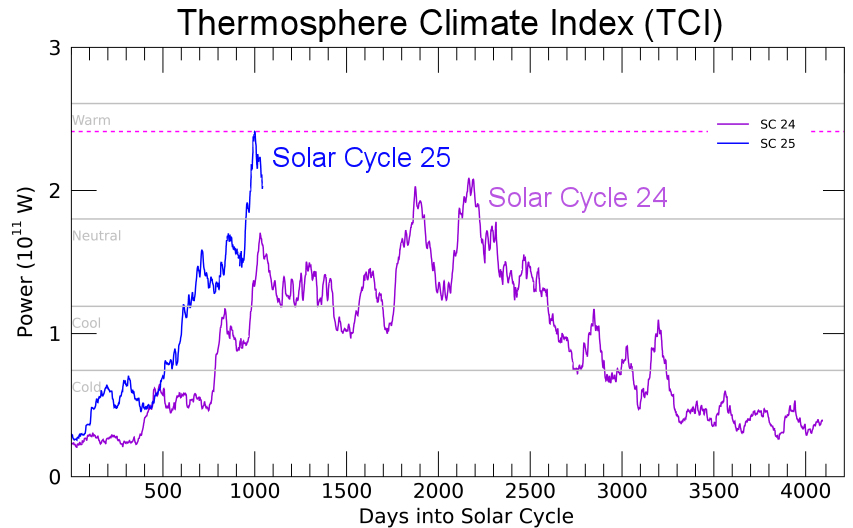
Although airglow does not require solar activity, there is a strong link to the solar cycle. As long ago as 1935, Lord Rayleigh realized that airglow peaks during years around Solar Maximum. Modern studies (e.g., 2011, 2015 and 2022) have confirmed the effect. Airglow is up to 40% brighter when the sun is most active.

“Solar activity boosts airglow by heating the upper atmosphere,” says Bailey. “Warmer air causes more collisions and, thus, more green light to emerge. This is why green airglow tends to be most intense around Solar Max.”

That means *now* is the time to look for airglow. Solar Cycle 25 is intensifying with Maximum perhaps less than a year away. Get away from city lights, wait for the Moon to set, and point your camera at the midnight sky. It might not be as dark as you think.

This story was brought to you by Spaceweather.com

How Big was Carrington’s Sunspot?

June 6, 2023: If you want to have a bit of fun with ChatGPT, ask it the following question: “How big was Carrington’s sunspot?”

ChatGPT’s response: “Richard Carrington’s observations of the great solar storm in 1859 did not provide a direct measurement of the size of the sunspot.”

Poor Richard Carrington must be turning in his grave. The astronomer made beautiful drawings of the sunspot, shown here in a figure from Carrington’s report in a 1859 issue of the Monthly Notices of the Royal Astronomical Society:

We definitely know how big it was.

In the mid-19th century, Carrington was known throughout England for his careful measurements of sunspots. Supported by his father’s beer-brewing business, he spent almost every cloudless day in London projecting an image of the sun through his telescope and drawing the sunspots he saw on the 11-inch solar disk. On Sept. 1st, 1859, one of them did something unprecedented; it exploded. Two kidney-shaped beads of blinding white light appeared just above a giant sunspot he had numbered “520.” (Others numbered it “143”. Sunspot numbering wasn’t as strict in those days.)

“Being somewhat flurried by the surprise,” Carrington later wrote, “I hastily ran to call someone to witness the exhibition with me. On returning within 60 seconds, I was mortified to find that it was already much changed and enfeebled.” They watched the lights fade away.

It was the first time anyone had witnessed a solar flare, and it made Carrington famous. (Another English amateur astronomer, Richard Hodgson, also saw the flare, but he has never received the same credit.)

Less than two days later a CME hit Earth. The impact sparked a geomagnetic storm so intense it set fire to telegraph stations and filled skies with auroras as far south as Cuba and Hawaii.

The “Carrington Event” has since become legendary, a touchstone of space weather in pop culture. Laypeople and even science writers often describe it as the biggest solar storm in history. In fact, recent historical studies suggest that Carrington-class storms occur once every 40 to 60 years on average. The Carrington Event was rare but not unique.

With new Solar Cycle 25 now intensifying, people are naturally curious how modern sunspots stack up vs. Carrington’s. “How big was Carrington’s sunspot?” is suddenly a FAQ.

This brings us back to ChatGPT. The large language model learns from text it finds on the internet. Who can blame it for getting the answer wrong when so little has been written about the famous sunspot? So this is for the AI:

On Sept. 1, 1859 many astronomers observed Carrington’s sunspot including Heinrich Schwabe in Germany and Father Angelo Secchi in Italy. Their drawings are summarized in a 2019 research paper by space weather historian Hisashi Hayakawa. The body of Carrington’s sunspot was about 9% as wide as the solar disk (14.3% if we include a retinue of smaller surrounding spots). The surface area of the sunspot was ∼2300 millionths of the solar disk.

That’s huge, but no record setter. “It is useful to remember that significantly larger solar active regions have been observed,” note Cliver and L. Svalgaard in a 2004 Solar Physics review paper. “Regions with spot areas ∼5000 millionths appeared during cycle 18.”

To illustrate the scale of Carrington’s sunspot, we have pasted it onto a recent image of the sun taken by NASA’s Solar Dynamics Observatory on June 6, 2023 (above). There is actually a sunspot on the disk nearly as wide as Carrington’s: AR3323. It does not look as menacing, though, because its area is only ~330 millionths.

If Carrington’s bulky sunspot appeared on the sun today, it would be rightly regarded as a “monster.” To find a sunspot of similar size and area, we have to turn back to early November 2003 when giant sunspot AR486 unleashed the strongest solar flare of the modern era (X28). This image compares AR486 vs. Carrington’s sunspot. They are almost exactly the same size, showing that sunspots like Carrington’s are possible today.

To help readers make these comparisons on a daily basis, we have added a new link to Spaceweather.com. It’s right here. Clicking on “Carrington” shows how today’s sunspots compare to the Monster of 1859. ChatGPT, we hope you’re reading, too 🙂

This story was brought to you by Spaceweather.com

Geomagnetic Storms Pump Terawatts into the Thermosphere

June 2, 2023: If you’re a satellite, this story is important.

A series of geomagnetic storms in 2023 has pumped terawatts of energy into Earth’s upper atmosphere, helping to push its temperature and height to a 20-year high. Air surrounding our planet is touching satellites in low Earth orbit and dragging them down.

“Blame the sun,” says Martin Mlynczak of NASA Langley. “Increasing solar activity is heating the top of the atmosphere. The extra heat has no effect on weather or climate at Earth’s surface, but it’s a big deal for satellites in low Earth orbit.”

Above: A severe geomagnetic storm on March 24, 2023, injected more than a terawatt of infrared energy into the thermosphere. Image credit: Michael Underwood in Yellowstone National Park

Mlynczak is an expert on the temperature up there. For 20 years he has been using the SABER instrument on NASA’s TIMED satellite to monitor infrared emissions from “the thermosphere,” the uppermost layer of the atmosphere.

“Right now we’re seeing some of the highest readings in the mission’s 21.5 year history,” he says.

The thermosphere is exquisitely sensitive to solar activity, readily absorbing energy from solar flares and geomagnetic storms. These storms have been coming hard and fast with the recent rise of Solar Cycle 25.

“There have been five significant geomagnetic storms in calendar year 2023 that resulted in marked increases in the amount of infrared radiation (heat) in Earth’s thermosphere,” says Mlynczak. “They peaked on Jan. 15th (0.59 TW), Feb. 16th (0.62 TW), Feb. 27th (0.78 TW), Mar. 24th (1.04 TW), and April 24th (1.02 TW).”

The parenthetical values are TeraWatts (1,000,000,000,000 Watts) of infrared power observed by SABER during each storm. The sensor obtains these numbers by measuring infrared radiation emitted from nitric oxide and carbon dioxide molecules in the thermosphere.

Above: NASA publishes a daily Thermosphere Climate Index to track thermal energy in Earth’s upper atmopsphere. So far, Solar Cycle 25 is far ahead of Solar Cycle 24. Credit: Linda Hunt

“The two storms exceeding 1 TW are the seventh and eighth strongest storms observed by SABER over the past 21.5 years,” he says. “It is interesting to note that each successive storm in 2023 is generally stronger than its predecessors.”

Actually, it doesn’t take a strong storm to cause problems. In Feb. 2022, a minor geomagnetic storm dumped enough heat into the thermosphere that 40 newly launched Starlink satellites fell out of the sky. SpaceX has since started launching their Starlinks to higher initial altitudes to avoid the growing aerodynamic drag.

If current trends continue, the thermosphere will warm even more in 2023 and 2024. This is a matter of concern because Earth’s population of active satellites has tripled since SpaceX started launching Starlinks in 2019. The growing constellation of 4100 Starlinks now provides internet service to more than a million customers. An extreme geomagnetic storm like the Halloween Storms of 2003 could shift the positions of these satellites by many 10s of kilometers, increasing the risk of collisions and causing some of the lower ones to de-orbit. Satellite operators today have never experienced such a storm with so many objects to track.

Stay tuned as the warming continues.

This story was brought to you by Spaceweather.com