What is E-RAD?

Aug. 14, 2018: E-RAD is a new model of aviation radiation from Spaceweather.com and Earth to Sky Calculus. It can predict how much cosmic radiation a passenger will absorb flying on any commercial jet across the USA.

Researchers have long known that cosmic rays penetrate the hulls of commercial aircraft. At typical cruising altitudes, pilots, flight attendants and passengers typically receive a dose rate 40 to 70 times higher than natural radiation on the ground below. The higher a plane flies, the more radiation it receives. This has prompted the International Commission on Radiological Protection (ICRP) to classify pilots as occupational radiation workers–just like nuclear power plant engineers.

Image result for cosmic rays aviation radiation

Most people stepping onboard an airplane have no idea they are about to encounter cosmic rays–much less do they know what the dose rate might be. And that is where E-RAD comes in. Enter a flight number and voila!–E-RAD predicts your exposure to cosmic rays.

This new model has been years in the making. Since Jan. 2015, Spaceweather.com and the students of Earth to Sky Calculus have been monitoring cosmic rays in airplanes. Our method is simple: We board planes carrying the same cosmic ray payload we routinely fly to the stratosphere on space weather balloons. Inside the airplane we measure X-rays, gamma-rays and neutron dose rates, along with GPS altitude, latitude and longitude.

flightpaths
Above: Flight paths forming the basis of our aviation radiation study. 2015-2017

Our data set is impressive. So far we have gathered 18,518 GPS-tagged radiation measurements during 72 flights over 2 oceans and 5 continents. We have spent 276.6 hours onboard planes taking data. These numbers are increasing rapidly with new flights every month.

The E in E-RAD stand for “Empirical.” In other words, the model is based on real-life measurements, not theoretical calculations that might be wrong. Moreover, our data-set is fresh. Because it is constantly being updated, E-RAD naturally keeps up with variables that affect cosmic rays–for instance, the waxing and waning of the solar cycle and changes in Earth’s magnetic field.

At the moment, the bulk of our data (70%) are concentrated over the continental USA, and that is where our predictions are best. For instance, here is a flight from Baltimore to Las Vegas in July 2018:

eradvreality

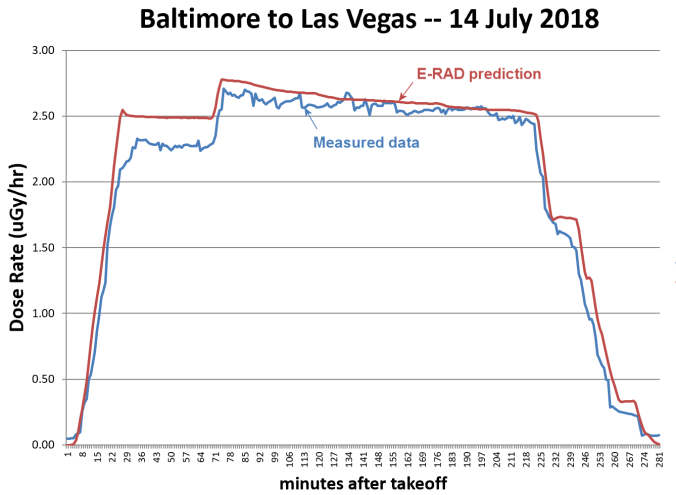
The blue curve traces radiation dose rates actually observed inside the airplane, while the red curve is E-RAD’s prediction. The two agree within 10% for most of the flight. These errors are constantly shrinking as we add new readings to our database.

We are also improving our model outside the continental USA. Recent trips to Nepal, Hong Kong, Australia and New Zealand, have added hundreds of hours of new data to the foundation of E-RAD.  Soon, we will be able to issue predictions for those areas as well.

Stay tuned for updates from 35,000 feet.

Ashes Scattered in the Stratosphere

Jan. 14, 2018: In August 2016, geologist Lee Allison, the director of the Arizona Geological Survey, passed away. On Dec. 31, 2017, the students of Earth to Sky Calculus flew his ashes to the stratosphere using a robotic ash scatterer. The space weather balloon flight, which also gathered data on atmospheric radiation, was sponsored by Lee’s wife Ann Becker to honor Lee and mark the sky-high impact he had on colleagues, students, friends and family.

“Lee was always interested in space,” says Ann, “and like a lot of us who grew up with the space program, he always wanted to go into space. Funding a balloon flight and spreading his ashes in the stratosphere are definitely things he would have appreciated.

“I grew up in central Wyoming. Our 9th grade earth science teachers conducted field science programs (geology and botany mostly) in the summer. I think science programs outside the normal school day can change a young person’s trajectory. They certainly changed mine. Ultimately I studied geophysics and earned a PhD in seismology.

“I remember something my high school senior year AP calculus teacher said (1969, right after the Apollo 11 mission): that the boys in the class were the astronauts of the future, and the girls would be their wives and support them. I’m pleased that times have changed, pleased that there are programs like Earth to Sky Calculus that make it easier for young women to not bury their intelligence or interests because society says they’re supposed to.

“Lee always supported women in geology,” concludes Ann. “He was one of the founding members of the Salt Lake chapter of the Assn for Women Geoscientists. A STEM program like Earth to Sky Calculus is one he would support.”

Atmospheric Radiation is Increasing

Dec. 9, 2017: Since the spring of 2015, Spaceweather.com and the students of Earth to Sky Calculus have been flying balloons to the stratosphere over California to measure cosmic rays. Soon after our monitoring program began, we quickly realized that radiation levels are increasing. Why? The main reason is the solar cycle. In recent years, sunspot counts have plummeted as the sun’s magnetic field weakens. This has allowed more cosmic rays from deep space to penetrate the solar system. As 2017 winds down, our latest measurements show the radiation increase continuing apace–with an interesting exception, circled in yellow:

In Sept. 2017, the quiet sun surprised space weather forecasters with a sudden outburst of explosive activity. On Sept. 3rd, a huge sunspot appeared. In the week that followed, it unleashed the strongest solar flare in more than a decade (X9-class), hurled a powerful CME toward Earth, and sparked a severe geomagnetic storm (G4-class) with Northern Lights appearing as far south as Arkansas. During the storm we quickened the pace of balloon launches and found radiation dropping to levels we hadn’t seen since 2015. The flurry of solar flares and CMEs actually pushed some cosmic rays away from Earth.

Interestingly, after the sun’s outburst, radiation levels in the stratosphere took more than 2 months to fully rebound. Now they are back on track, increasing steadily as the quiet sun resumes its progress toward Solar Minimum. The solar cycle is not expected to hit rock bottom until 2019 or 2020, so cosmic rays should continue to increase, significantly, in the months and years ahead. Stay tuned for updates as our balloons continue to fly.

Technical note: The radiation sensors onboard our helium balloons detect X-rays and gamma-rays in the energy range 10 keV to 20 MeV. These energies, which span the range of medical X-ray machines and airport security scanners, trace secondary cosmic rays, the spray of debris created when primary cosmic rays from deep space hit the top of Earth’s atmosphere.

Cosmic Rays Intensify: May 2017

May 7, 2017: As the sunspot cycle declines, we expect cosmic rays to increase. Is this actually happening? The answer is “yes.” Spaceweather.com and the students of Earth to Sky Calculus have been monitoring radiation levels in the stratosphere with frequent high-altitude balloon flights over California. Here are the latest results, current as of May 6, 2017:

The data show cosmic ray levels intensifying with an approximately 13% increase since March 2015.

Cosmic rays are high-energy photons and subatomic particles accelerated in our direction by distant supernovas and other violent events in the Milky Way. Usually, cosmic rays are held at bay by the sun’s magnetic field, which envelops and protects all the planets in the Solar System. But the sun’s magnetic shield is weakening in 2017 as the solar cycle shifts from Solar Maximum to Solar Minimum. More and more cosmic rays are therefore reaching our planet.

How does this affect us? Cosmic rays penetrate commercial airlines, dosing passengers and flight crews enough that pilots are classified as occupational radiation workers. Some research shows that cosmic rays can seed clouds and trigger lightning, potentially altering weather and climate. Furthermore, there are studies ( #1, #2, #3, #4) linking cosmic rays with cardiac arrhythmias in the general population.

The sensors we send to the stratosphere measure X-rays and gamma-rays, which are produced by the crash of primary cosmic rays into Earth’s atmosphere. The energy range of the sensors, 10 keV to 20 MeV, is similar to that of medical X-ray machines and airport security scanners.

Arctic Space Weather Balloon Launch

March 3, 2017: Spaceweather.com is going to Sweden–and we’re taking a team of student researchers from Earth to Sky Calculus with us. For a week beginning on March 9th we plan to launch a series of space weather balloons equipped with cosmic ray sensors and cameras into the stratosphere above the Arctic Circle. At the same time, Earth to Sky launch teams in Chile and California will be sending up identical payloads, forming an intercontinental balloon network:

We’re doing this for three reasons:

1. To understand Earth’s changing radiation environment: Regular monitoring of the stratosphere over California shows that cosmic rays have intensified more than 10% since 2015.  Because of a recent decline in the solar cycle, more and more cosmic rays are reaching the inner solar system and penetrating the atmosphere of our planet. Earth’s magnetic field should protect us against these rays, but geomagnetism is weakening. Globally, Earth’s magnetic field has declined in strength by 10% since the 19th century with changes accelerating in recent years, according to measurements by Europe’s SWARM satellites. To understand Earth’s global response to these changes, we must launch balloons and sample radiation from widely-spaced locations.  The upcoming network launch will span three continents, more than 14,000 km of linear distance, and 90+ degrees of latitude.


Above: Satellite data show that Earth’s magnetic field is changing: full story.

2. To photograph the Northern Lights: We will be launching balloons from Abisko, Sweden, 250 km inside the Arctic Circle. Abisko is famous for spectacular auroras. One of our payloads will carry a low-light camera capable of photographing these lights from the stratosphere. Even at 120,000 feet, the balloon will be well below the auroras, but we will be a lot closer than any camera on the ground

3. To sample polar stratospheric clouds: During winter months, the stratosphere above the Arctic Circle sometimes fills with icy clouds so colorful, they are likened to the aurora borealis. Polar stratospheric clouds (PSCs) are a sign of extremely cold temperatures in the stratosphere and some types of PSCs are responsible for ozone destruction. Our space weather balloons can fly right through these clouds, sampling their temperature, pressure, and ambient levels of radiation.  We can also photograph them from the inside–a possible first!


Above: Polar stratospheric clouds over Kiruna, Sweden, on Feb. 14. Credit: Mia Stålnacke

Stay tuned for daily updates beginning March 9th.

Sunspot Cycle at Lowest Level in 5 Years

Nov. 15, 2016: The sun has looked remarkably blank lately, with few dark cores interrupting the featureless solar disk.  This is a sign that Solar Minimum is coming.  Indeed, sunspot counts have just reached their lowest level since 2011. With respect to the sunspot cycle, you are here:

The solar cycle is like a pendulum, swinging back and forth between periods of high and low sunspot number every 11 years. These data from NOAA show that the pendulum is swinging toward low sunspot numbers even faster than expected. (The red line is the forecast; black dots are actual measurements.). Given the current progression, forecasters expect the cycle to bottom out with a deep Solar Minimum in 2019-2020.

Solar Minimum is widely misunderstood.  Many people think it brings a period of dull quiet. In fact, space weather changes in interesting ways. For instance, as the extreme ultraviolet output of the sun decreases, the upper atmosphere of Earth cools and collapses. This allows space junk to accumulate around our planet. Also, the heliosphere shrinks, bringing interstellar space closer to Earth; galactic cosmic rays penetrate the inner solar system and our atmosphere with relative ease. (More on this below.) Meanwhile, geomagnetic storms and auroras will continue–caused mainly by solar wind streams instead of CMEs. Indeed, Solar Minimum is coming, but it won’t be dull.

COSMIC RAYS CONTINUE TO INTENSIFY: As the sunspot cycle declines, we expect cosmic rays to increase. Is this actually happening? The answer is “yes.” Spaceweather.com and the students of Earth to Sky Calculus have been monitoring radiation levels in the stratosphere with frequent high-altitude balloon flights over California. Here are the latest results, current as of Nov. 11, 2016:

Data show that cosmic ray levels are intensifying with an 11% increase since March 2015.

Cosmic rays are high-energy photons and subatomic particles accelerated in our direction by distant supernovas and other violent events in the Milky Way. Usually, cosmic rays are held at bay by the sun’s magnetic field, which envelops and protects all the planets in the Solar System. But the sun’s magnetic shield is weakening as the solar cycle shifts from Solar Max to Solar Minimum. As the sunspot cycle goes down, cosmic rays go up.

The sensors we send to the stratosphere measure X-rays and gamma-rays which are produced by the crash of primary cosmic rays into Earth’s atmosphere. In this way we are able to track increasing levels of radiation. The increase is expected to continue for years to come as solar activity plunges toward a deep Solar Minimum in 2019-2020.

Recently, we have expanded the scope of our measurements beyond California with launch sites in three continents: North America, South America and soon above the Arctic Circle in Europe. This Intercontinental Space Weather Balloon Network will allow us to probe the variable protection we receive from Earth’s magnetic field and atmosphere as a function of location around the globe.

Intercontinental Space Weather Balloon Network

For the past 2 years, Spaceweather.com and the students of Earth to Sky Calculus have been launching “space weather balloons” to measure cosmic rays in the atmosphere.  Regular flights over California show that atmospheric radiation is intensifying in response to changes in the solar cycle.  Now, our monitoring program is going global.  In recent months we have been developing launch sites in multiple US states as well as South America and Europe. This is what the International Space Weather Ballooning Network looks like in October 2016:

Recent additions expand our coverage north of the Arctic Circle (Sweden) and closer to the core of the South Atlantic Anomaly (Argentina).  We also hope to add a site in Antarctica in 2018.

The purpose of launching balloons from so many places is to map out the distribution of cosmic rays around our planet. A single launch site is simply not enough to reveal the nonuniform shielding of our planet’s magnetic field and the complicated response of our atmosphere to changes in solar activity.

Our first test of the network validated these ideas. During a 48 hour period from August 20th-22nd we launched 4 balloons in quick succession from southern Chile, California, Oregon, and Washington. The ascending payloads sampled atmospheric radiation (X-rays and gamma-rays) from ground level to the stratosphere over a geographical range of more than 10,000 km. Here are the results:

The curves show radiation levels vs. altitude for each of the four sites. Numbers in parentheses are magnetic latitude–a measure of distance from Earth’s magnetic equator.

At a glance we can see that atmospheric radiation is a strong function of magnetic latitude. Washington State at +53o has more than twice the amount of radiation as southern Chile at -29o–despite the fact that the Chilean balloon flew into the outskirts of the South Atlantic Anomaly. Clearly, Earth’s magnetic field provides very uneven protection against cosmic rays.

To explore these findings further, we are planning additional network launches every month from now on, adding new sites as often as possible. A launch from inside the Arctic Circle in January 2017 is highly anticipated. Stay tuned for updates from the Intercontinental SWx Balloon Network.

New Maps of the South Atlantic Anomaly

by Dr. Tony Phillips (Spaceweather.com)

Sept. 30, 2016: Researchers have long known that one of the van Allen Radiation Belts dips down toward Earth over South America, creating a zone of high radiation called “The South Atlantic Anomaly” (SAA). Since its discovery in 1958, the SAA has been shape-shifting, growing larger and intensifying.  A map published just last week in the American Geophysical Union’s journal Space Weather Quarterly outlines the anomaly with new precision:

When a spacecraft in low-Earth orbit passes through the anomaly, “the radiation causes faults in spacecraft electronics and can induce false instrument readings,” explains Bob Schaefer of the Johns Hopkins University Applied Physics Lab, lead author of the paper reporting the results. “We actually used these spurious signals to map out the radiation environment at an altitude of 850 km.”

Specifically, they looked at pulses of noise in an ultraviolet photometer carried aboard many polar orbiting Defense Meteorological Satellite Program (DMSP) satellites. When high-energy protons in the SAA pass through these sensors, they  produce spurious signals–or, in the case of this study, valuable data. By monitoring the rate of spurious UV pulses, the researchers were able to trace the outlines of the anomaly and monitor its evolution over a period of years.

They found that the anomaly is slowly drifting north and west at rates of 0.16 deg/yr and 0.36 deg/yr, respectively. Currently, it is most intense over a broad region centered on Sao Paulo, Brazil, including much of Paraguay, Uruguay, and northern Argentina. They also detected a seasonal variation: On average, the SAA is most intense in February and again in September-October. In this plot, yearly average counts have been subtracted to reveal the double-peaked pattern:

One maximum coincides with an equinox, but the other does not. The authors were not able to explain the origin of this unexpected pattern.

The solar cycle matters, too, as the data revealed a yin-yang anti-correlation with sunspots. “During years of high solar activity, the radiation intensity is lower, while during solar quiet years the radiation intensity is higher,” writes Schaefer.

According to orthodox thinking, the SAA reaches down from space to within about 200 km of Earth’s surface. Below that altitude, its effects should be mitigated by the shielding of Earth’s atmosphere and geomagnetic field. To test this idea, Spaceweather.com and Earth to Sky Calculus have undertaken a program to map the SAA from below using weather balloons equipped with radiation sensors.  Next week we will share the results of our first flight from a launch site in Chile.  Stay tuned!

Cosmic Rays are Intensifying

by Dr. Tony Phillips (Spaceweather.com)

Aug. 30, 2016: Researchers have long known that solar activity and cosmic rays have a yin-yang relationship. As solar activity declines, cosmic rays intensify. Lately, solar activity has been very low indeed. Are cosmic rays responding? The answer is “yes.” Spaceweather.com and the students of Earth to Sky Calculus have been using helium balloons to monitor cosmic rays in the stratosphere over California. Their latest data show an increase of almost 13% since 2015.


Cosmic rays, which are accelerated toward Earth by distant supernova explosions and other violent events, are an important form of space weather. They can seed clouds, trigger lightning, and penetrate commercial airplanes. Furthermore, there are studies ( #1, #2, #3, #4) linking cosmic rays with cardiac arrhythmias and sudden cardiac death in the general population.

Why are cosmic rays intensifying? The main reason is the sun. Solar storm clouds such as coronal mass ejections (CMEs) sweep aside cosmic rays when they pass by Earth. During Solar Maximum, CMEs are abundant and cosmic rays are held at bay. Now, however, the solar cycle is swinging toward Solar Minimum, allowing cosmic rays to return. Another reason could be the weakening of Earth’s magnetic field, which helps protect us from deep-space radiation.

The radiation sensors onboard our helium balloons detect X-rays and gamma-rays in the energy range 10 keV to 20 MeV. These energies span the range of medical X-ray machines and airport security scanners.

The data points in the graph above correspond to the peak of the Reneger-Pfotzer maximum, which lies about 67,000 feet above central California. When cosmic rays crash into Earth’s atmosphere, they produce a spray of secondary particles that is most intense at the entrance to the stratosphere. Physicists Eric Reneger and Georg Pfotzer discovered this maximum using balloons in the 1930s and it is what we are measuring today.

Cosmic Rays vs. Clouds

The connection between cosmic rays and clouds has long been controversial.  Some researchers hold that cosmic rays hitting Earth’s atmosphere create aerosols which, in turn, seed clouds.  This could make cosmic rays an important player in weather and climate.  Other researchers are less convinced.  Although some laboratory experiments support the idea that cosmic rays help seed clouds, skeptics say the effect is too small to substantially affect the cloudiness of our planet or to avert the course of climate change.

A new study just published in the Aug. 19th issue of Journal of Geophysical Research: Space Physics comes down in favor of cosmic rays. A team of scientists from the Technical University of Denmark (DTU) and the Hebrew University of Jerusalem has linked sudden decreases in cosmic rays (called “Forbush Decreases”) to changes in Earth’s cloud cover.

Forbush Decreases occur when solar storms called “coronal mass ejections (CMEs)” sweep past Earth.  Magnetic fields in CMEs deflect cosmic rays and, essentially, sweep some of the cosmic rays away from our planet.  The research team led by Jacob Svensmark of DTU identified the strongest 26 Forbush Decreases between 1987 and 2007, and looked at ground-based+satellite records of cloud cover to see what happened.  In a press release, their conclusions were summarized as follows: “[Strong Forbush Decreases] cause a reduction in cloud fraction of about 2 percent corresponding to roughly a billion tonnes of liquid water disappearing from the atmosphere.”

If true, that’s amazing.  It would also underscore the importance of measuring cosmic rays in the atmosphere.  Recent balloon flights by Spaceweather.com and Earth to Sky Calculus show that cosmic rays are intensifying. Cloudy days, anyone?