Intercontinental Space Weather Balloon Network

For the past 2 years, Spaceweather.com and the students of Earth to Sky Calculus have been launching “space weather balloons” to measure cosmic rays in the atmosphere.  Regular flights over California show that atmospheric radiation is intensifying in response to changes in the solar cycle.  Now, our monitoring program is going global.  In recent months we have been developing launch sites in multiple US states as well as South America and Europe. This is what the International Space Weather Ballooning Network looks like in October 2016:

Recent additions expand our coverage north of the Arctic Circle (Sweden) and closer to the core of the South Atlantic Anomaly (Argentina).  We also hope to add a site in Antarctica in 2018.

The purpose of launching balloons from so many places is to map out the distribution of cosmic rays around our planet. A single launch site is simply not enough to reveal the nonuniform shielding of our planet’s magnetic field and the complicated response of our atmosphere to changes in solar activity.

Our first test of the network validated these ideas. During a 48 hour period from August 20th-22nd we launched 4 balloons in quick succession from southern Chile, California, Oregon, and Washington. The ascending payloads sampled atmospheric radiation (X-rays and gamma-rays) from ground level to the stratosphere over a geographical range of more than 10,000 km. Here are the results:

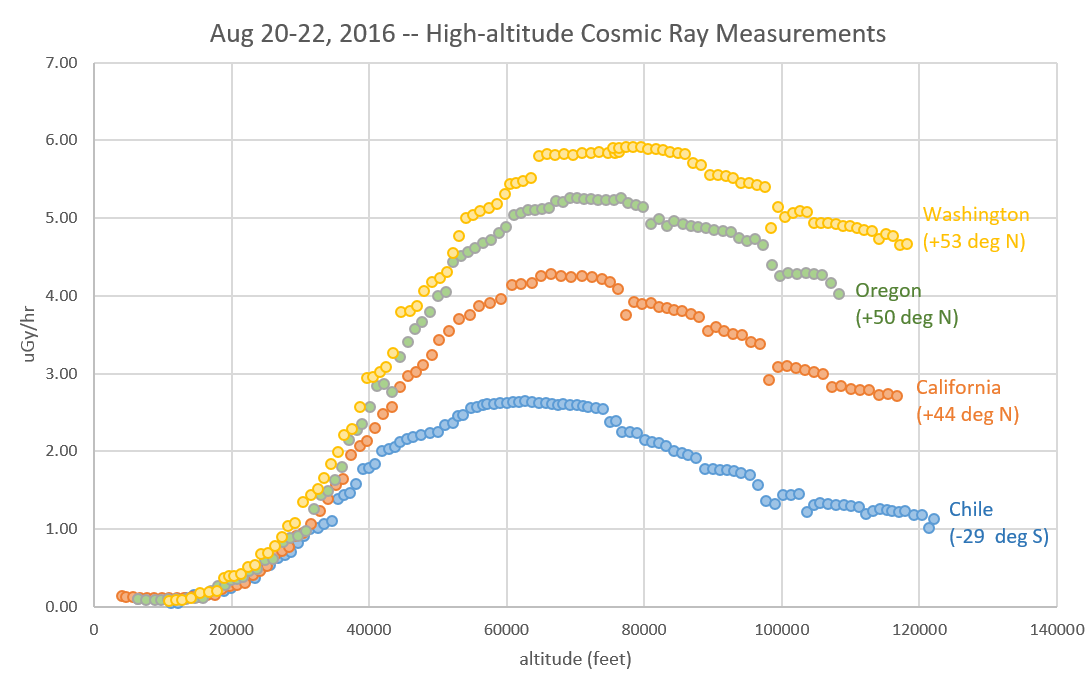
The curves show radiation levels vs. altitude for each of the four sites. Numbers in parentheses are magnetic latitude–a measure of distance from Earth’s magnetic equator.

At a glance we can see that atmospheric radiation is a strong function of magnetic latitude. Washington State at +53o has more than twice the amount of radiation as southern Chile at -29o–despite the fact that the Chilean balloon flew into the outskirts of the South Atlantic Anomaly. Clearly, Earth’s magnetic field provides very uneven protection against cosmic rays.

To explore these findings further, we are planning additional network launches every month from now on, adding new sites as often as possible. A launch from inside the Arctic Circle in January 2017 is highly anticipated. Stay tuned for updates from the Intercontinental SWx Balloon Network.

New Maps of the South Atlantic Anomaly

by Dr. Tony Phillips (Spaceweather.com)

Sept. 30, 2016: Researchers have long known that one of the van Allen Radiation Belts dips down toward Earth over South America, creating a zone of high radiation called “The South Atlantic Anomaly” (SAA). Since its discovery in 1958, the SAA has been shape-shifting, growing larger and intensifying.  A map published just last week in the American Geophysical Union’s journal Space Weather Quarterly outlines the anomaly with new precision:

When a spacecraft in low-Earth orbit passes through the anomaly, “the radiation causes faults in spacecraft electronics and can induce false instrument readings,” explains Bob Schaefer of the Johns Hopkins University Applied Physics Lab, lead author of the paper reporting the results. “We actually used these spurious signals to map out the radiation environment at an altitude of 850 km.”

Specifically, they looked at pulses of noise in an ultraviolet photometer carried aboard many polar orbiting Defense Meteorological Satellite Program (DMSP) satellites. When high-energy protons in the SAA pass through these sensors, they  produce spurious signals–or, in the case of this study, valuable data. By monitoring the rate of spurious UV pulses, the researchers were able to trace the outlines of the anomaly and monitor its evolution over a period of years.

They found that the anomaly is slowly drifting north and west at rates of 0.16 deg/yr and 0.36 deg/yr, respectively. Currently, it is most intense over a broad region centered on Sao Paulo, Brazil, including much of Paraguay, Uruguay, and northern Argentina. They also detected a seasonal variation: On average, the SAA is most intense in February and again in September-October. In this plot, yearly average counts have been subtracted to reveal the double-peaked pattern:

One maximum coincides with an equinox, but the other does not. The authors were not able to explain the origin of this unexpected pattern.

The solar cycle matters, too, as the data revealed a yin-yang anti-correlation with sunspots. “During years of high solar activity, the radiation intensity is lower, while during solar quiet years the radiation intensity is higher,” writes Schaefer.

According to orthodox thinking, the SAA reaches down from space to within about 200 km of Earth’s surface. Below that altitude, its effects should be mitigated by the shielding of Earth’s atmosphere and geomagnetic field. To test this idea, Spaceweather.com and Earth to Sky Calculus have undertaken a program to map the SAA from below using weather balloons equipped with radiation sensors.  Next week we will share the results of our first flight from a launch site in Chile.  Stay tuned!