Cosmic Rays Increasing for the 4th Year in a Row

Feb. 21, 2019: Cosmic rays in the stratosphere are intensifying for the 4th year in a row. This finding comes from a campaign of almost weekly high-altitude balloon launches conducted by the students of Earth to Sky Calculus. Since March 2015, there has been a ~13% increase in X-rays and gamma-rays over central California, where the students have launched hundreds of balloons.

neutronsandxrays2

The grey points in the graph are Earth to Sky balloon data. Overlaid on that time series is a record of neutron monitor data from the Sodankyla Geophysical Observatory in Oulu, Finland. The correlation between the two data sets is impressive, especially considering their wide geographic separation and differing methodologies. Neutron monitors have long been considered a “gold standard” for monitoring cosmic rays on Earth. This shows that our student-built balloons are gathering data of similar quality.

Why are cosmic rays increasing? The short answer is “Solar Minimum.” Right now, the 11-year solar cycle is plunging into one of the deepest minima of the Space Age. The sun’s weakening magnetic field and flagging solar wind are not protecting us as usual from deep-space radiation. Earth to Sky balloon launches in multiple countries and US states show that this is a widespread phenomenon.

solarcycle

Cosmic rays are of interest to anyone who flies on airplanes. The International Commission on Radiological Protection has classified pilots as occupational radiation workers because of cosmic ray doses they receive while flying. A recent study by researchers at the Harvard School of Public Health shows that flight attendants face an elevated risk of cancer compared to members of the general population. They listed cosmic rays as one of several risk factors. There are also controversial studies that suggest cosmic rays promote the formation of clouds in the atmosphere; if so, increasing cosmic rays could affect weather and climate.

Voyager 2 Reaches Interstellar Space

Dec. 10, 2018: Voyager 2 has exited the sun’s magnetic bubble and entered interstellar space. Mission scientists announced the breakthrough yesterday at the American Geophysical Union meeting in Washington DC. Its twin, Voyager 1, crossed the same boundary in 2012, but Voyager 2’s crossing is arguably more significant because it carries a working instrument that can sense interstellar plasmas, providing the first in situ sampling of matter between the stars.

The most compelling evidence of Voyager 2’s exit from the heliosphere came from its onboard Plasma Science Experiment (PLS), an instrument that stopped working on Voyager 1 in 1980. Until recently, Voyager 2 was surrounded mainly by the solar wind–a type of plasma flowing outward from the sun. On Nov. 5th, Voyager 2’s plasma instrument observed a sharp decline in the solar wind, and since that date, it has observed no solar wind flow–a clear sign that the probe has left the heliosphere.

Replacing the solar wind is a blizzard of galactic cosmic rays. The sun’s magnetic field substantially protects the solar system from cosmic rays, fending off the high energy debris of supernova explosions in the Milky Way and elsewhere. Now that Voyager 2 has exited that protective shell, it is baldly exposed to cosmic rays, and its cosmic ray subsystem is registering a surge.

Launched in 1977, Voyager 2 now is slightly more than 11 billion miles (18 billion kilometers) from Earth. Mission operators still can communicate with Voyager 2 as it enters this new phase of its journey, but information – moving at the speed of light – takes about 16.5 hours to travel from the spacecraft to Earth.

The Voyager probes are powered using heat from the decay of radioactive material, contained in a radioisotope thermal generator (RTG). The power output of the RTGs diminishes by about four watts per year, which means that various parts of the Voyagers, including the cameras on both spacecraft, have been turned off over time to manage power. Thanks to these precautions, the Voyagers could continue to send back at least some data for years to come.

“There is still a lot to learn about the region of interstellar space immediately beyond the heliosphere,” said Ed Stone, Voyager project scientist based at Caltech in Pasadena, California. Stay tuned for updates from the stars.

Realtime Space Weather Photo Gallery

CHRISTMAS GIFTS FROM THE EDGE OF SPACE: So far in 2018, the students of Earth to Sky Calculus have launched 42 space weather balloons to the stratosphere, measuring cosmic rays over 3 continents, 2 hemispheres, and 7 different US states. You can help them pay their helium bill by purchasing a Christmas gift from the edge of space:

Every item in the Earth to Sky Store has flown to the stratosphere alongside an array of cosmic ray sensors. Carried aloft by giant balloons, these unique gifts travel above 99.7% of Earth’s atmosphere, experiencing space-like blasts of cosmic rays, extreme cold, and a wild ride parachuting back to Earth after the balloon explodes. Even Amazon doesn’t carry items this far out!

Don’t forget to enter coupon code “SPACESANTA” at checkout for a 10% holiday discount.

Far Out Gifts: Earth to Sky Store
All sales support hands-on STEM education

Atmospheric Radiation Increasing from Coast to Coast in the USA

Oct. 24, 2018: So you thought Solar Minimum was boring? Think again. High-altitude balloon flights conducted by Spaceweather.com and Earth to Sky Calculus show that atmospheric radiation is intensifying from coast to coast over the USA–an ironic result of low solar activity. Take a look at the data:

atmospheric_radiation2

Above: Radiation dose rates at the Regener-Pfotzer Maximum, ~65,000 ft high at the entrance to the stratosphere.

Since 2015, we have been monitoring X-rays, gamma-rays and neutrons in the stratosphere–mainly over central California, but also in a dozen other states (NV, OR, WA, ID, WY, KS, NE, MO, IL, ME, NH, VT). Everywhere we have been there is an upward trend in radiation–ranging from +20% in central California to +33% in Maine. The latest points, circled in red, were gathered during a ballooning campaign in August-October 2018.

How does Solar Minimum boost radiation? The answer lies in the yin-yang relationship between cosmic rays and solar activity. Cosmic rays are the subatomic debris of exploding stars and other violent events. They come at us from all directions, 24/7. Normally, the sun’s magnetic field and solar wind hold cosmic rays at bay–but during Solar Minimum these defenses weaken. Deep-space radiation surges into the solar system.

sunspotnumbers_oct2018

Cosmic rays crashing into our planet’s atmosphere produce a spray of secondary particles and photons. That secondary spray is what we measure. Each balloon flight, which typically reaches an altitude greater than 100,00o feet, gives us a complete profile of radiation from ground level to the stratosphere. Our sensors sample energies between 10 keV and 20 MeV, spanning the range of medical X-ray machines, airport security devices, and “killer electrons” in Earth’s radiation belts.

Who cares? For starters, anyone who flies. Cosmic radiation at aviation altitudes is typically 50 times that of natural sources at sea level. Pilots are classified as occupational radiation workers by the International Commission on Radiological Protection (ICRP) and, according to a recent study from researchers at the Harvard School of Public Health, flight attendants face an elevated risk of cancer compared to members of the general population. They listed cosmic rays as one of several risk factors. Weather and climate may also be affected, with some research linking cosmic rays to to the formation of clouds and lightning. Finally, there are studies (one recently published in Nature) asserting that heart rate variability and cardiac arrhythmias are affected by cosmic rays in some populations. If true, it means the effects reach all the way to the ground.

As 2018 comes to an end, Solar Minimum appears to be just getting started. Cosmic rays could continue to increase for years to come, so stay tuned.

Realtime Space Weather Photo Gallery

Atmospheric Radiation Update: July 2018

July 30, 2018: As the sunspot cycle declines, we expect cosmic rays to increase. Is this actually happening? The answer is “yes.” Spaceweather.com and the students of Earth to Sky Calculus have been monitoring cosmic radiation in the atmosphere with frequent high-altitude balloon flights over California. Here are the latest results, current as of July 2018:

X-ray/gamma-ray dose rates in the stratosphere over California. Energy range: 10 keV – 20 MeV

The data show radiation levels intensifying with an approximately 18% increase in monthly averages since March 2015. This comes as sunspot counts have dipped to a ~10-year low in June and July 2018.

Cosmic rays are the subatomic debris of dying stars, accelerated to nearly light speed by supernova explosions. They travel across the galaxy and approach Earth from all directions, peppering our planet 24/7. When cosmic rays crash into Earth’s atmosphere, they produce a spray of secondary particles and photons that is most intense at the entrance to the stratosphere. This secondary spray is what we measure.


Above: An artist’s rendering of secondary cosmic rays. [more]

Sunspots and cosmic rays have a yin-yang relationship. At the peak of the sunspot cycle, strong solar magnetic fields and solar wind hold many cosmic rays at bay. During solar minimum, however, the sun’s magnetic field weakens and the outward pressure of the solar wind decreases. This allows more cosmic rays from deep space to penetrate the inner solar system and our planet’s atmosphere.

The increase is widespread. Every place in the USA where we have launched multiple balloons exhibits the same pattern. There are upward trends from coast to coast:

The plot, above, shows more than 150 stratospheric radiation measurements we have made using balloons flown over the continental USA. Because California is our home base, it is more densely sampled than other states. Adding additional points outside California remains a key goal of the monitoring program.

How do cosmic rays affect us? Cosmic rays penetrate commercial airlines, dosing passengers and flight crews so much that pilots are classified as occupational radiation workers by the International Commission on Radiological Protection (ICRP). According to a recent study from researchers at the Harvard School of Public Health, flight attendants face an elevated risk of cancer compared to members of the general population. The investigators listed cosmic rays among several risk factors. Weather and climate may also be affected, with some research linking cosmic rays to to the formation of clouds and lightning.

In August-December 2018 we will conduct a new campaign of coordinated balloon launches from the USA (including sites in California, Washington, Kansas, Oregon, and Maine), Chile, and New Zealand to further probe the evolving cosmic ray situation. As solar activity declines we expect to find increasing radiation around the globe. Stay tuned for updates.

Spiders and the Global Electrical Circuit

July 20, 2018: Did you know that spiders can fly? Biologists call it “ballooning.” Spiders spin a strand of silk, it juts into the air, and off they go. Airborne arachnids have been found as high as 4 km off the ground. Originally, researchers thought spiders were riding currents of air, but there’s a problem with that idea. Spiders often take flight when the air is calm, and large spiders fly even when air currents are insufficient to support their weight. It’s a mystery.

Scientists from the University of Bristol may have found the solution. In a paper published in the July 5th edition of Current Biology, they proved that spiders can propel themselves using electric fields.

ballooningspider_strip

Just before ballooning, spiders adopt a posture shown here called “tiptoeing.”

“We exposed adult Linyphiid spiders (Erigone) to electric fields similar to those which naturally occur in Earth’s atmosphere,” explains the paper’s lead author, Erica Morley. “Spiders showed a significant increase in ballooning in the presence of electric fields.” A remarkable video of their experiment shows one spider flying when the fields were switched on, then landing when the fields were off again. It appears conclusive.

The electric fields spiders use for propulsion are part of Earth’s global atmospheric electric circuit (GEC)–a planet-sized circuit of electricity that researchers have known about since the 1920s. In a nutshell, thunderstorms help build up a charge difference between the ground and the ionosphere 50 km overhead. The voltage drop is a staggering 250,000 volts. This sets up electric fields linking Earth to the edge of space. Cosmic rays ionize Earth’s atmosphere, turning it into a weak conductor that allows currents to flow through the GEC. [Ref]

gec_crop

This diagram, borrowed from K. A. Nicoll’s 2014 review paper “Space Weather influences on Atmospheric Electricity,” illustrates the role of thunderstorms and cosmic rays in creating electric fields.

Spiders evolved inside the global electric circuit, so it’s no surprise that they have learned to tap into it. But how? Peter W. Gorham of the Dept. of Physics and Astronomy at the University of Hawaii notes that “the complex protein structure of spider silk includes charge-bearing amino acids glutamic acid and arginine, which might be generated in a charged state as part of the spinning process. [Alternately, those acids might be able to attract charge] from the local launching surface as strands are spun from the sharp nozzles of the spinneret.” [Ref]

Researchers have long wondered about the role of electricity in spider flight. Charles Darwin may have been the first. He wrote about it during his voyages on the HMS Beagle (1831-1836). One day, the ship was 60 miles off the coast of Argentina when the deck was inundated by ballooning spiders. “The day was hot and apparently quite calm,” he wrote, yet “I repeatedly observed the same kind of small spider, either when placed or having crawled on some little eminence, elevate its abdomen, send forth a thread, and then sail away horizontally, but with a rapidity which was quite unaccountable.” He was particularly struck by spiders using multiple strands of silk that splayed out in fan-like shapes. Instead of tangling as they moved through the air, the strands remained separate. Were they repelled by an electrostatic force? Darwin wondered in his writings. The work of Erica Morley and her collaborator Daniel Robert closes the loop on a train of thought almost 200 years old.

spiderhairs_crop

Hairs on the legs of spiders called “trichobothria” twitch when electric fields are present–a signal to the spider that ballooning may commence.

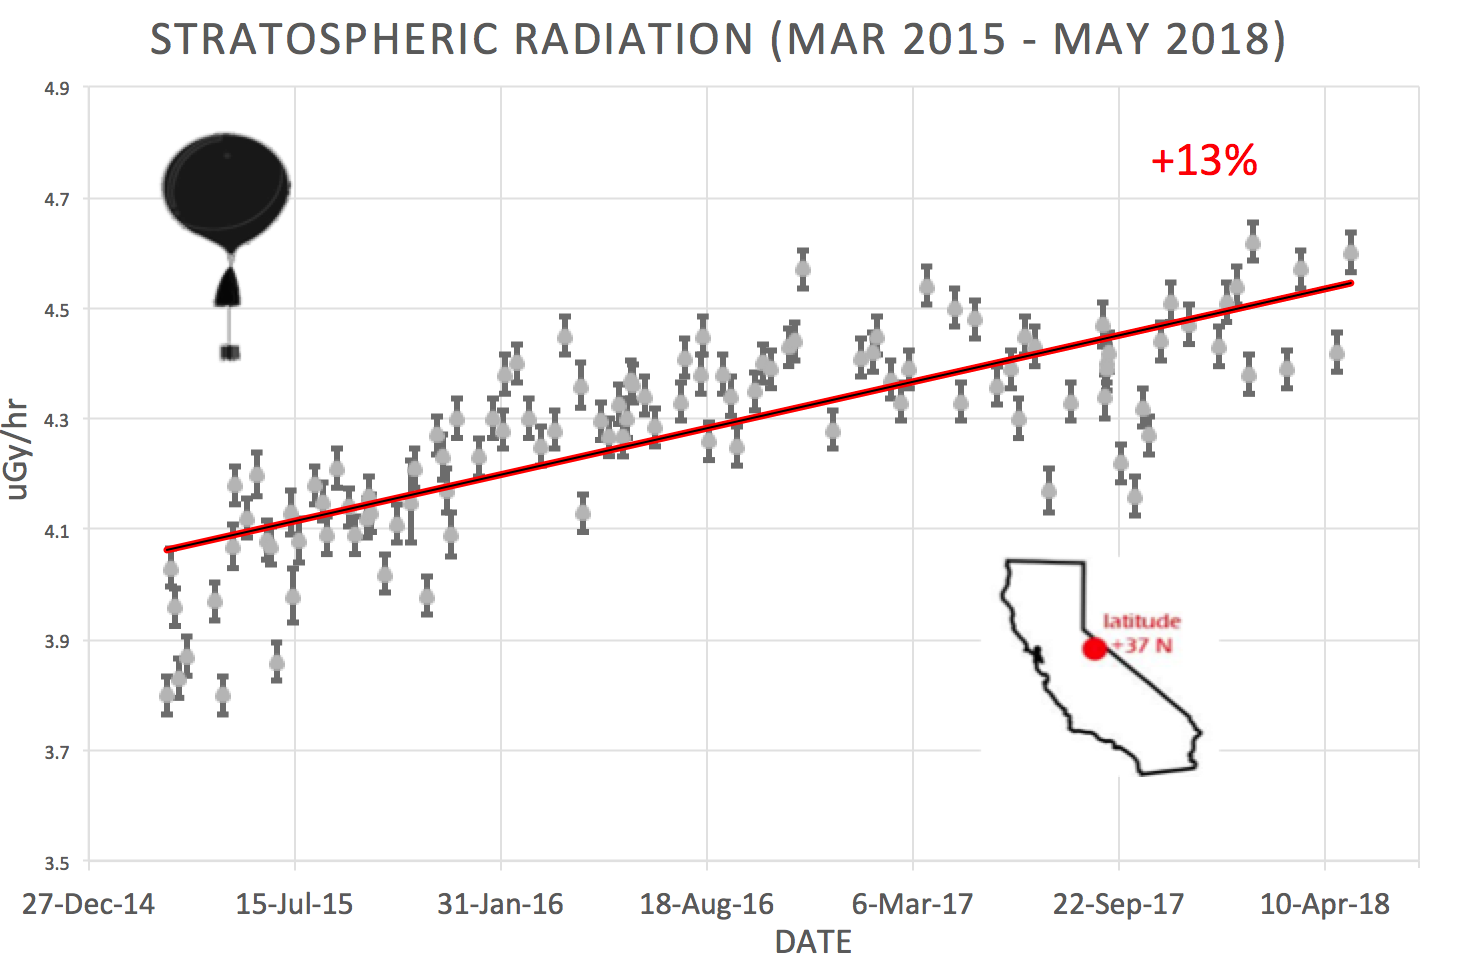
All of this raises the possibility that spiders may be affected by space weather as electric fields are perturbed by cosmic rays and solar activity. Research groups have demonstrated connections between space weather and atmospheric electricity on a variety of time scales.  Days: Coronal mass ejections (CMEs) from the sun can sweep aside cosmic rays as they pass by Earth, causing temporary reductions in atmospheric ionization as large as 30%. Our own Spaceweather.com/Earth to Sky cosmic ray balloons have measured these events. [RefMonths: Measurements at the Reading University Atmospheric Observatory in the UK have shown that voltages can fluctuate +-15% as Earth dips in and out of the heliospheric current sheet (a huge corrugated magnetic structure centered on the sun) every ~27 days. [RefYears: During the 20th century, fair weather atmospheric voltages at sites in Scotland and the UK decreased by factors of ~25% due to a long-term decrease in cosmic rays. [Ref] That slow trend is now reversing itself as cosmic rays intensify again.

Could the migration patterns of ballooning spiders be affected by space weather? “It’s entirely possible, but we simply don’t yet know,” says Morley. “The experiments we have carried out are mostly lab-based, which helps eliminate confounding variables. A next step in the project is to take this all into the field and look for patterns. Factoring in solar activity could be very interesting.”

Stay tuned.

Global Cosmic Radiation Measurements

June 10, 2018: For the past two years, Spaceweather.com and the students of Earth to Sky Calculus have been traveling around the world, launching cosmic ray balloons to map our planet’s radiation environment. Our sensors travel from ground level to the stratosphere and bring their data back to Earth by parachute. Here is a plot showing radiation vs. altitude in Norway, Chile, Mexico, and selected locations in the USA:


Note: Data from Sweden and several other US states are omitted for the clarity of the plot.

We’re about to add a new country to the list: New Zealand. On June 18th, a team of students from Earth to Sky is traveling to New Zealand’s north island to launch 3 cosmic ray balloons in only 10 days. Soon, we will know more about cosmic rays above Earth’s 8th continent.

Cosmic rays are, essentially, the subatomic debris of dying stars, accelerated to nearly light speed by supernova explosions. They travel across space and approach Earth from all directions, peppering our planet 24/7. When cosmic rays crash into Earth’s atmosphere, they produce a spray of secondary particles and photons that is most intense at the entrance to the stratosphere. This secondary spray is what we measure.

The purpose of our mapping project is to study how well Earth’s atmosphere and magnetic field protects us from cosmic rays. As the plot shows, the shielding is uneven. More radiation gets through to the poles (e.g., Norway) and less radiation penetrates near the equator (e.g., Mexico).

But there’s more to the story. Our launch sites in Chile and California are equidistant from the equator, yet their radiation profiles are sharply different. Chile is on the verge of the South Atlantic Anomaly, which almost surely distorts the radiation field there. Our flights over New Zealand may shed some light on this, because our launch sites in New Zealand will be the same distance from the equator as the sites in Chile. Stay tuned!

Technical note: The radiation sensors onboard our helium balloons detect X-rays and gamma-rays in the energy range 10 keV to 20 MeV. These energies span the range of medical X-ray machines and airport security scanners.

What is the Regener-Pfotzer Maximum?

June 7, 2018: About once a week, Spaceweather.com and the students of Earth to Sky Calculus launch a helium balloon with radiation  sensors to the stratosphere over California. This is a unique monitoring program aimed at tracking the cosmic ray situation in Earth’s atmosphere. During each flight, our balloon passes through something called the Regener-Pfotzer Maximum, a layer of peak radiation about 20 km above Earth’s surface. This plot of radiation vs. time taken during a July 2015 balloon flight illustrates the peak:

figure1_agu
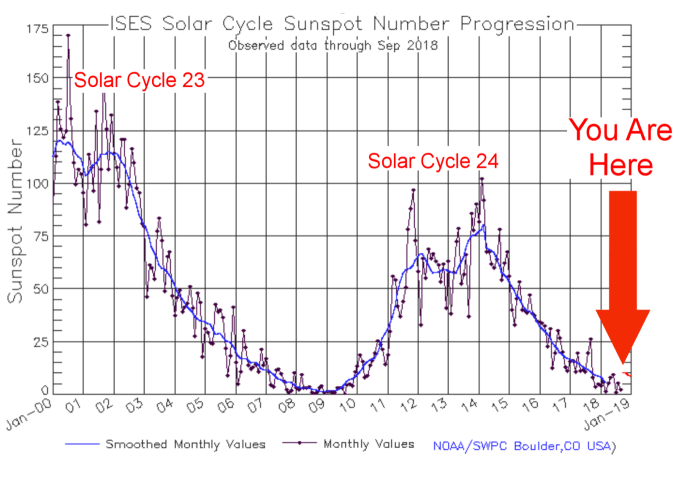
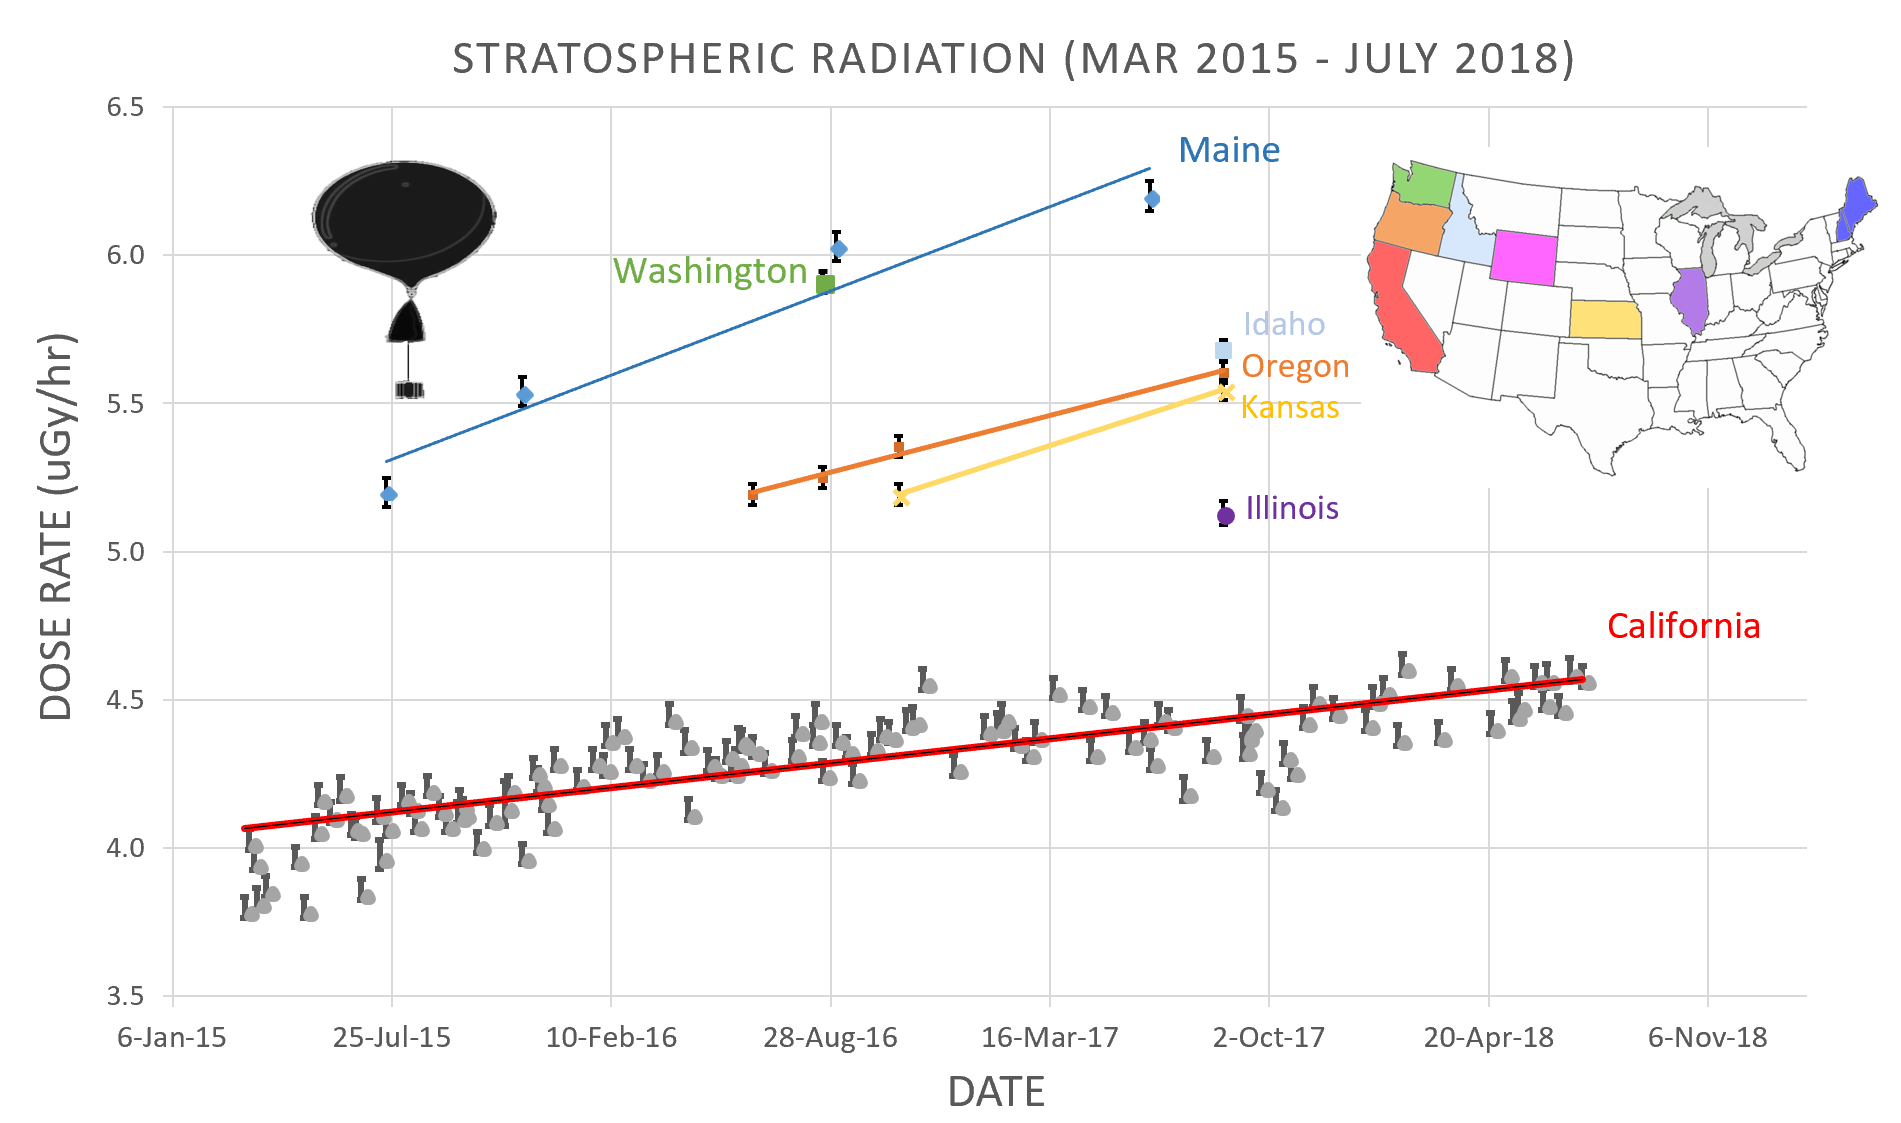
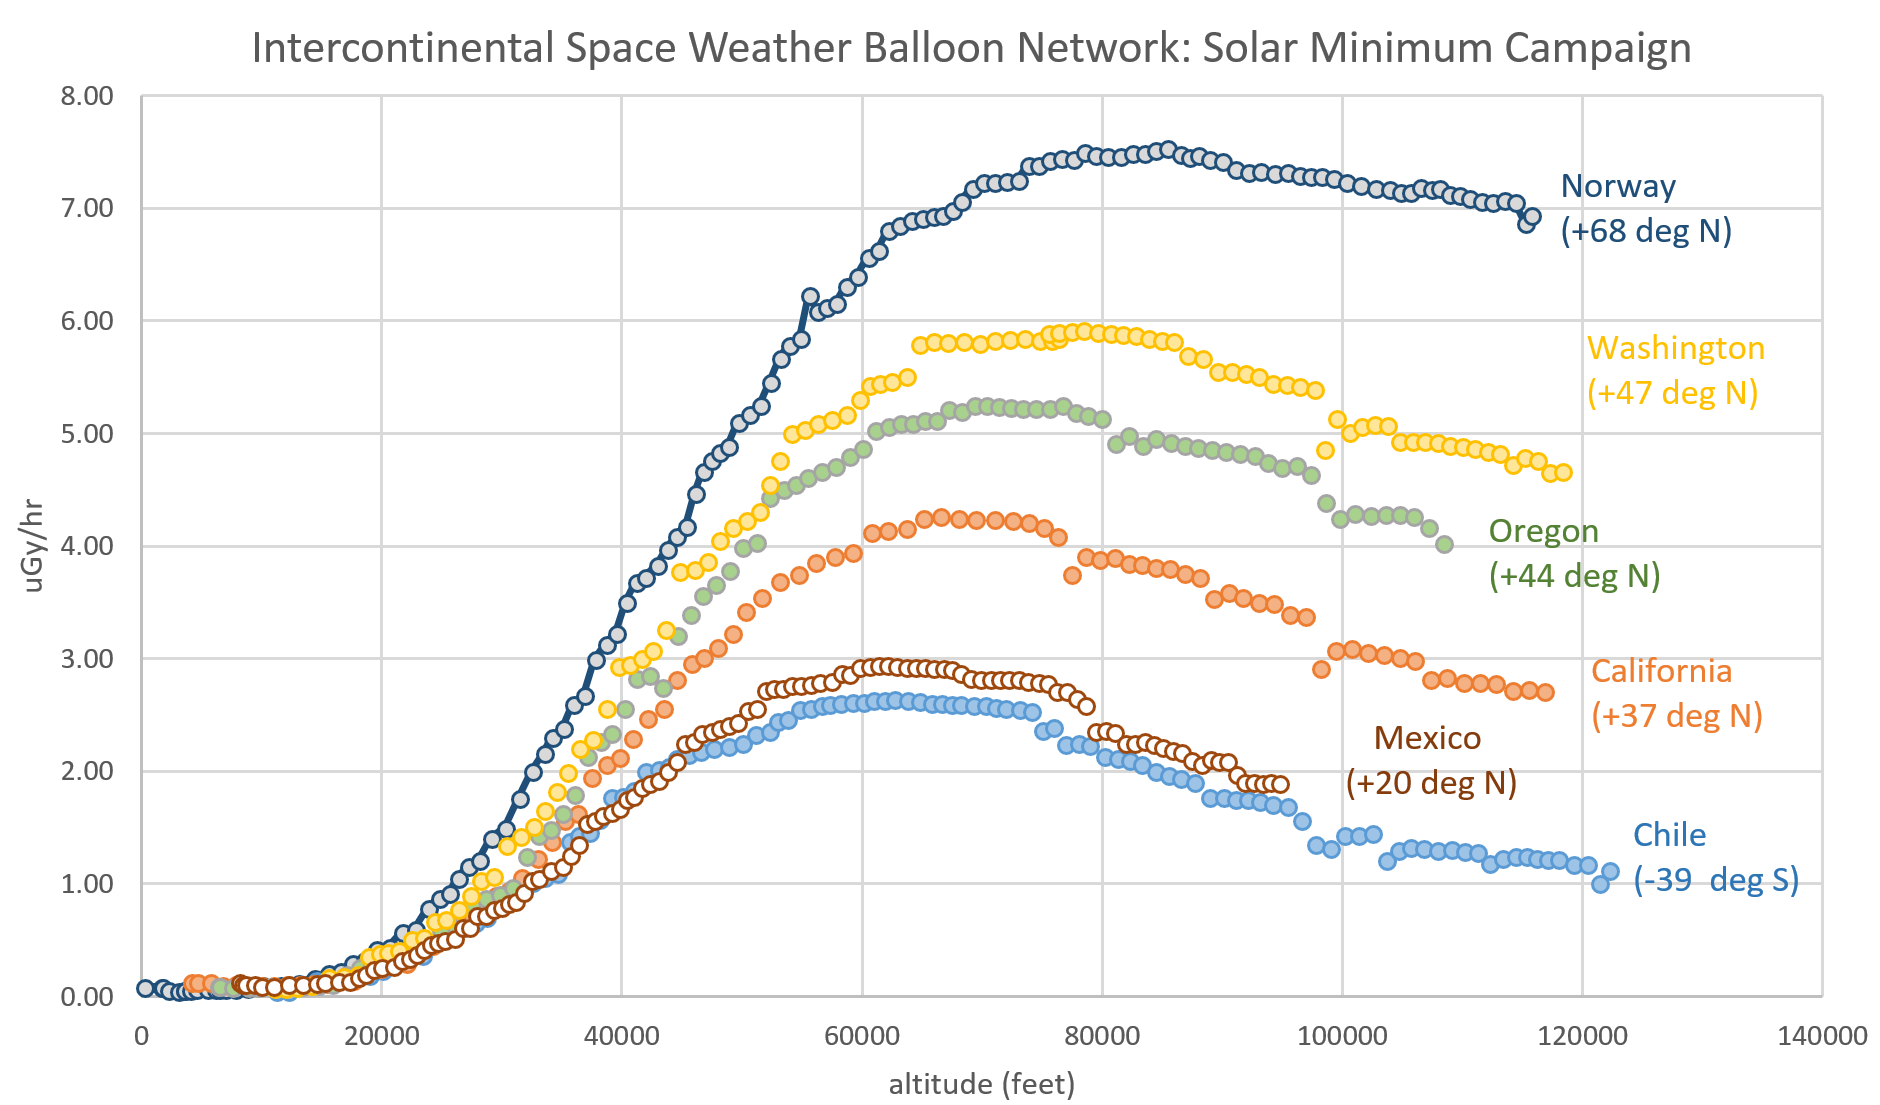
Image source: Phillips, T., et al. (2016), Space Weather Ballooning, Space Weather, 14, 697–703, doi: 10.1002/2016SW001410.

What is this peak? To understand it, let us begin in deep space. Cosmic rays are, essentially, the subatomic debris of dying stars, accelerated to nearly light speed by supernova explosions. They travel across space and approach Earth from all directions, peppering our planet 24/7. When cosmic rays crash into Earth’s atmosphere, they produce a spray of secondary particles and photons that is most intense at the entrance to the stratosphere. Physicists Eric Regener and Georg Pfotzer discovered the maximum using balloons in the 1930s and it is what we are measuring today.

In some ways, secondary cosmic rays are like froth on the ocean. By watching the froth, you can learn a lot about the underlying water. Likewise, by watching secondary cosmic rays, we learn a lot about primary cosmic rays hitting the top of the atmosphere. Indeed, our balloon measurements have recently confirmed what NASA spacecraft are finding: The cosmic ray situation is worsening.

cr_strip

For many years, the Regener-Pfotzer Maximum was called, simply, the “Pfotzer Maximum.” Regener’s name is less recognized by present-day physicists largely because in 1937 he was forced to take early retirement by the National Socialists as his wife had Jewish ancestors. This interesting story weaving science, politics, and human nature has recently been told by historians of science P. Carlson and A. A. Watson. Ref: Hist. Geo Space. Sci., 5, 175-182, 2014.

Technical note: The radiation sensors onboard our helium balloons detect X-rays and gamma-rays in the energy range 10 keV to 20 MeV. These energies span the range of medical X-ray machines and airport security scanners.

Jellyfish Sprites over Oklahoma

May 25, 2018: Last night, a swarm of luminous jellyfish appeared over Oklahoma. “A swarm of jellyfish sprites, that is,” says Paul Smith, who photographed them rising above an intense thunderstorm near Oklahoma City:

“The sprites were about 80 miles away from me,” says Smith. “At that distance I could see over the tops of the storm cells where the jellyfish appear. I’ve photographed many sprites from 200 to 300 miles away. These, however, were unusually nearby, and they are my best pictures yet.”

Sprites are an exotic form of upward directed lightning. Although the forms have been seen for at least a century, many scientists did not believe they existed until after 1989 when sprites were photographed by cameras onboard the space shuttle. Now “sprite chasers” like Smith routinely photograph them from their own homes.

“I have been recording sprites since last summer when I accidentally caught a few during the Perseid meteor shower,” says Smith. “I have a couple of hundred events on camera now and I am out almost every night there are storms in my vicinity. This month I have driven for five hours some nights trying to find a clear view over active cells.”


The blue pushpin is Smith’s location; the arrow points to the sprites he saw on May 24, 2018.

Oklahoma is the epicenter of a region that we call “Sprite Alley”–a corridor stretching across the US Great Plains where intense thunderstorms produce lots of upward directed lightning. Already this year we have received reports of sprites and their stronger cousins, Gigantic Jets, from Texas to Nebraska. And summer thunderstorm season isn’t even fully underway yet.

Some researchers think that sprites may be linked to cosmic rays: Subatomic particles from deep space strike the top of Earth’s atmosphere, producing secondary electrons that trigger the upward bolts. If this is true, then sprites could multiply in the months and years ahead as cosmic rays intensify due to the decline of the solar cycle. More sprite images may be found on Paul Smith’s Facebook page.

Realtime Sprite Photo Gallery

Atmospheric Radiation Update

May 21, 2018: Cosmic rays over California continue to intensify, according to high-altitude balloons launched by Spaceweather.com and the students of Earth to Sky Calculus. We’ve been monitoring secondary cosmic rays in the stratosphere with regular launches from Bishop CA since 2015. In the data plot below, 3 of the 4 highest radiation measurements have occurred just in the past few months:

The worsening cosmic ray situation is linked to the solar cycle. Right now, the sun is heading toward a deep Solar Minimum. As the outward pressure of solar wind decreases, cosmic rays from deep space are able to penetrate the inner solar system with increasing ease. This same phenomenon is happening not only above California, but all over the world.

Take another look at the data plot. The general trend in radiation is increasing, but it is not perfectly linear. From launch to launch we see significant up and down fluctuations. These fluctuations are not measurement errors. Instead, they are caused by natural variations in the pressure and magnetization of the solar wind.

How does the overall increase affect us? Cosmic rays penetrate commercial airlines, dosing passengers and flight crews enough that pilots are classified as occupational radiation workers by the International Commission on Radiological Protection (ICRP). Some research suggests that cosmic rays can seed clouds and trigger lightning, potentially altering weather and climate. Furthermore, there are studies ( #1, #2, #3, #4) linking cosmic rays with cardiac arrhythmias in the general population.

The sensors we send to the stratosphere measure X-rays and gamma-rays, which are produced by the crash of primary cosmic rays into Earth’s atmosphere. The energy range of the sensors, 10 keV to 20 MeV, is similar to that of medical X-ray machines and airport security scanners. Stay tuned for updates as the monitoring program continues.

North Korea and Aviation Radiation

April 26, 2018:  For the past 4 years, Spaceweather.com and Earth to Sky Calculus have been flying radiation sensors onboard airplanes to map the distribution of cosmic rays around our planet. Our database currently contains more than 17,000 GPS-tagged radiation measurements spanning 5 continents and 43,000 feet of altitude. Yesterday, we realized we could use this database to investigate a current event–namely, the possibility of a radiation leak from North Korea.


Above: Earth to Sky Calculus X-ray/gamma radiation sensors onboard a plane

North Korea recently surprised observers by announcing a suspension of its underground nuclear testing program. Geologists in China quickly offered an explanation: Mount Mantap, which sits atop of the test site, had collapsed. The mountain crumbled in Sept. 2017 minutes after the North Korean regime exploded a 100 kiloton prototype weapon. According to the South China Morning Post, the China Earthquake Administration believes the collapse may have created a “chimney” that allows the escape of radioactive materials.

Is there any sign of radioactivity in the air space around North Korea? Our database contains four flights near the Korean Peninsula–two in March 2016 (before the collapse), and two more in Feb. 2018  (after the collapse). These are shown in the map, below, where orange circles of 350 miles and 700 miles radius are centered on nuclear test site. During each flight we sampled X-rays and gamma-rays in the energy range 10 keV to 20 MeV at one minute intervals, accumulating more than 600 data points. Low energy X-rays have been used in the past to trace radioactive fallout from atomic tests, so our measurements may have some bearing on the question.


Above: Red dots show where we have collected radiation data in airspace near N. Korea.

And the answer is …. no. Comparing radiation levels pre-collapse vs. post-collapse, we found no significant difference. For instance, radiation dose rates in March 2016 at 31,500 feet were 0.9 uGy/hr (18 times the natural rate at sea level). Radiation dose rates in February 2018 at the same altitude were 1.0 uGy/hr (20 times sea level), a slight increase within the uncertainty of the measurements. If radiation is leaking from the collapsed mountain site, it is not having a detectable effect on aviation over neighboring countries.