Atmospheric Radiation Update

May 21, 2018: Cosmic rays over California continue to intensify, according to high-altitude balloons launched by Spaceweather.com and the students of Earth to Sky Calculus. We’ve been monitoring secondary cosmic rays in the stratosphere with regular launches from Bishop CA since 2015. In the data plot below, 3 of the 4 highest radiation measurements have occurred just in the past few months:

The worsening cosmic ray situation is linked to the solar cycle. Right now, the sun is heading toward a deep Solar Minimum. As the outward pressure of solar wind decreases, cosmic rays from deep space are able to penetrate the inner solar system with increasing ease. This same phenomenon is happening not only above California, but all over the world.

Take another look at the data plot. The general trend in radiation is increasing, but it is not perfectly linear. From launch to launch we see significant up and down fluctuations. These fluctuations are not measurement errors. Instead, they are caused by natural variations in the pressure and magnetization of the solar wind.

How does the overall increase affect us? Cosmic rays penetrate commercial airlines, dosing passengers and flight crews enough that pilots are classified as occupational radiation workers by the International Commission on Radiological Protection (ICRP). Some research suggests that cosmic rays can seed clouds and trigger lightning, potentially altering weather and climate. Furthermore, there are studies ( #1, #2, #3, #4) linking cosmic rays with cardiac arrhythmias in the general population.

The sensors we send to the stratosphere measure X-rays and gamma-rays, which are produced by the crash of primary cosmic rays into Earth’s atmosphere. The energy range of the sensors, 10 keV to 20 MeV, is similar to that of medical X-ray machines and airport security scanners. Stay tuned for updates as the monitoring program continues.

What is the Da Vinci Glow?

May 15, 2018:  Five hundred years ago, Leonardo da Vinci proposed an outlandish theory explaining why the Moon’s surface glows after lunar nightfall. Turns out, his idea was correct. The Da Vinci Glow–also known as “Earthshine”–makes the entire lunar disk visible even when the sunlit fraction is just a few percent.

For much of human history, people marveled at the faint image of the full Moon inside the arms of the crescent. Where did it come from? No one knew until the 16th century when Leonardo figured it out. He realized that sunlight reflected from Earth lit up the lunar night.


Above: Da Vinci’s sketch of Earthshine in 1510 vs. Italian astronomer Riccardo Di Nasso’s photo of Earthshine in 2006.

Visualizing this in the 1500s required a wild kind of imagination. No one had ever been to the Moon and looked “up” at Earth. Most people didn’t even know that Earth orbited the sun. Copernicus’ sun-centered theory of the solar system wasn’t published until 1543, twenty-four years after Leonardo died.

Wild imagination was one thing Leonardo had in abundance. His notebooks are filled with sketches of flying machines, army tanks, scuba gear and other fantastic devices centuries ahead of their time.

In Leonardo’s Codex Leicester, circa 1510, there is a page entitled “Of the Moon: No Solid Body is Lighter than Air.” He states his belief that the “ghostly glow” is due to sunlight bouncing off Earth’s oceans and, in turn, hitting the Moon. 500 years later, we know that Earth’s clouds (not oceans) do most of the reflecting; but that is a quibble. Leonardo understood the basics well enough.

Go outside and look at the next crescent Moon. The Da Vinci Glow is waiting….

STEVE Travels South, Visits the USA

May 6, 2018:  On Saturday, May 5th, a stream of solar wind engulfed Earth, sparking G1 and G2-class geomagnetic storms through the weekend. High atop Earth’s atmosphere, hot ribbons of plasma began to flow through our planet’s magnetic field. Suddenly, STEVE appeared. Alan Dyer photographed the mauve ribbon of light over Gleichen, Alberta:

“STEVE, the strange auroral arc, put in quite the appearance on Sunday night, with a fine show over southern Alberta lasting about an hour,” says Dyer. “It started as a faint arc in the east, then intensified, cutting across the entire sky.”

STEVE (Strong Thermal Emission Velocity Enhancement) was discovered by sky watchers in Alberta only a few years ago, although the phenomenon was surely active long before. The narrow ribbon is related to auroras, but has a distinct shape, color, and habitat. Researchers are now beginning to understand STEVE as a manifestation of hot plasma currents in the upper atmosphere.

Elizabeth MacDonald of NASA’s Goddard Space Flight Center recently published a paper on STEVE. In it, they link STEVE to a phenomenon called “subauroral ion drifts” (SAIDs). Satellites have tracked thousands of SAIDs: They tend to appear most often during spring and fall and seem to prefer latitudes near +60 degrees.

This weekend, STEVE traveled farther south than usual. Greg Ash saw the ribbon over Ely, Minnesota, at latitude +47.9 N:

“As you can imagine, I was totally stoked,” says Ash. “This was my first STEVE sighting and it was unforgettable. It was visible with the naked eye and I could see the pulsations of green with the purple.”

Elsewhere, STEVE was sighted in Tofte, Minnesota (+47.6N), Buxton, North Dakota (+47.6 N), Arcadia, Michigan, (+44.5N) and Fort Frances, Ontario (+48.6N). These relatively low latitude apparitions are an encouraging sign for sky watchers who wish to see the strange ribbon for themselves. You don’t have to travel to the Arctic Circle to meet STEVE. He might be coming to you. Free: Aurora Alerts.

Realtime STEVE Photo Gallery

STEVE Visits the USA

May 6, 2018: On Saturday, May 5th, a stream of solar wind engulfed Earth, sparking G1 and G2-class geomagnetic storms through the weekend. High atop Earth’s atmosphere, hot ribbons of plasma began to flow through our planet’s magnetic field. Suddenly, STEVE appeared. Alan Dyer photographed the mauve ribbon of light over Gleichen, Alberta:

“STEVE, the strange auroral arc, put in quite the appearance on Sunday night, with a fine show over southern Alberta lasting about an hour,” says Dyer. “It started as a faint arc in the east, then intensified, cutting across the entire sky.”

STEVE (Strong Thermal Emission Velocity Enhancement) was discovered by sky watchers in Alberta only a few years ago, although the phenomenon was surely active long before. The narrow ribbon is related to auroras, but has a distinct shape, color, and habitat. Researchers are now beginning to understand STEVE as a manifestation of hot plasma currents in the upper atmosphere.

Elizabeth MacDonald of NASA’s Goddard Space Flight Center recently published a paper on STEVE. In it, they link STEVE to a phenomenon called “subauroral ion drifts” (SAIDs). Satellites have tracked thousands of SAIDs: They tend to appear most often during spring and fall and seem to prefer latitudes near +60 degrees.

This weekend, STEVE traveled farther south than usual. Greg Ash saw the ribbon over Ely, Minnesota, at latitude +47.9 N:

“As you can imagine, I was totally stoked,” says Ash. “This was my first STEVE sighting and it was unforgettable. It was visible with the naked eye and I could see the pulsations of green with the purple.”

Elsewhere, STEVE was sighted in Tofte, Minnesota (+47.6N), Buxton, North Dakota (+47.6 N), Arcadia, Michigan, (+44.5N) and Fort Frances, Ontario (+48.6N). These relatively low latitude apparitions are an encouraging sign for sky watchers who wish to see the strange ribbon for themselves. You don’t have to travel to the Arctic Circle to meet STEVE. He might be coming to you. Free: Aurora Alerts.

Realtime STEVE Photo Gallery

Sunspots Vanishing Faster than Expected

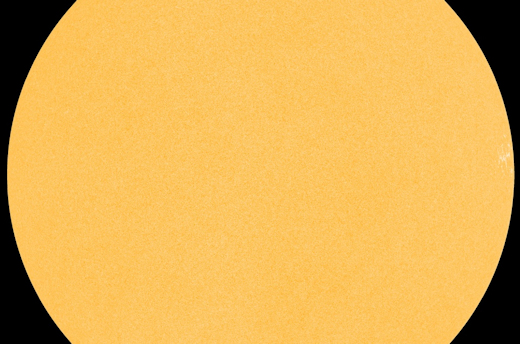
May 1, 2018: Sunspots are becoming scarce. Very scarce. So far in 2018 the sun has been blank almost 60% of the time, with whole weeks going by without sunspots. Today’s sun, shown here in an image from NASA’s Solar Dynamics Observatory, is typical of the featureless solar disk:

blank_strip

The fact that sunspots are vanishing comes as no surprise. Forecasters have been saying for years that this would happen as the current solar cycle (“solar cycle 24”) comes to an end. The surprise is how fast.

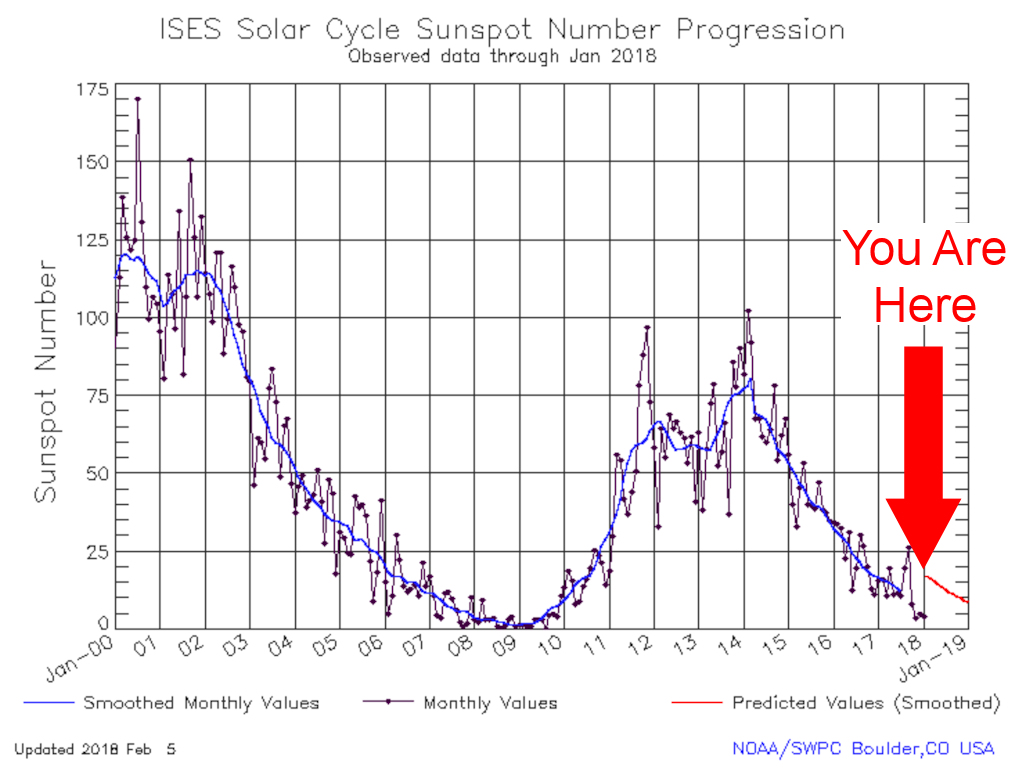
“Solar cycle 24 is declining more quickly than forecast,” announced NOAA’s Space Weather Prediction Center on April 26th. This plot shows observed sunspot numbers in blue vs. the official forecast in red:

progression_strip

“The smoothed, predicted sunspot number for April-May 2018 is about 15,” says NOAA. “However, the actual monthly values have been [significantly] lower.”

“Official” forecasts of the solar cycle come from NOAA’s Solar Cycle Prediction Panel–a group of experts from NOAA, NASA, the US Air Force, universities and other research organizations. They have been convening at intervals since 1989 to predict the timing and intensity of Solar Max. The problem is, no one really knows how to predict the solar cycle. The most recent iteration of the panel in 2006-2008 compared 54 different methods ranging from empirical extrapolations of historical data to cutting-edge supercomputer models of the sun’s magnetic dynamo. None fully described what is happening now.

It’s important to note that solar minimum is a normal part of the sunspot cycle. Sunspots have been disappearing (or nearly so) every ~11 years since 1843 when German astronomer Samuel Heinrich Schwabe discovered the periodic nature of solar activity. Sometimes they go away for decades, as happened during the Maunder Minimum of the 17th century.  We’ve seen it all before. Or have we….?

sunspotcycle2_strip

Researchers are keeping a wary eye on the sun now because of what happened the last time sunspots disappeared. The solar minimum of 2008-2009 was unusually deep. The sun set Space Age records for low sunspot number, weak solar wind, and depressed solar irradiance. When the sun finally woke up a few years later, it seemed to have “solar minimum hangover.” The bounce-back Solar Max of 2012-2015 was the weakest solar maximum of the Space Age, prompting some to wonder if solar activity is entering a  phase of sustained quiet. The faster-than-expected decline of the sunspot cycle now may support that idea.

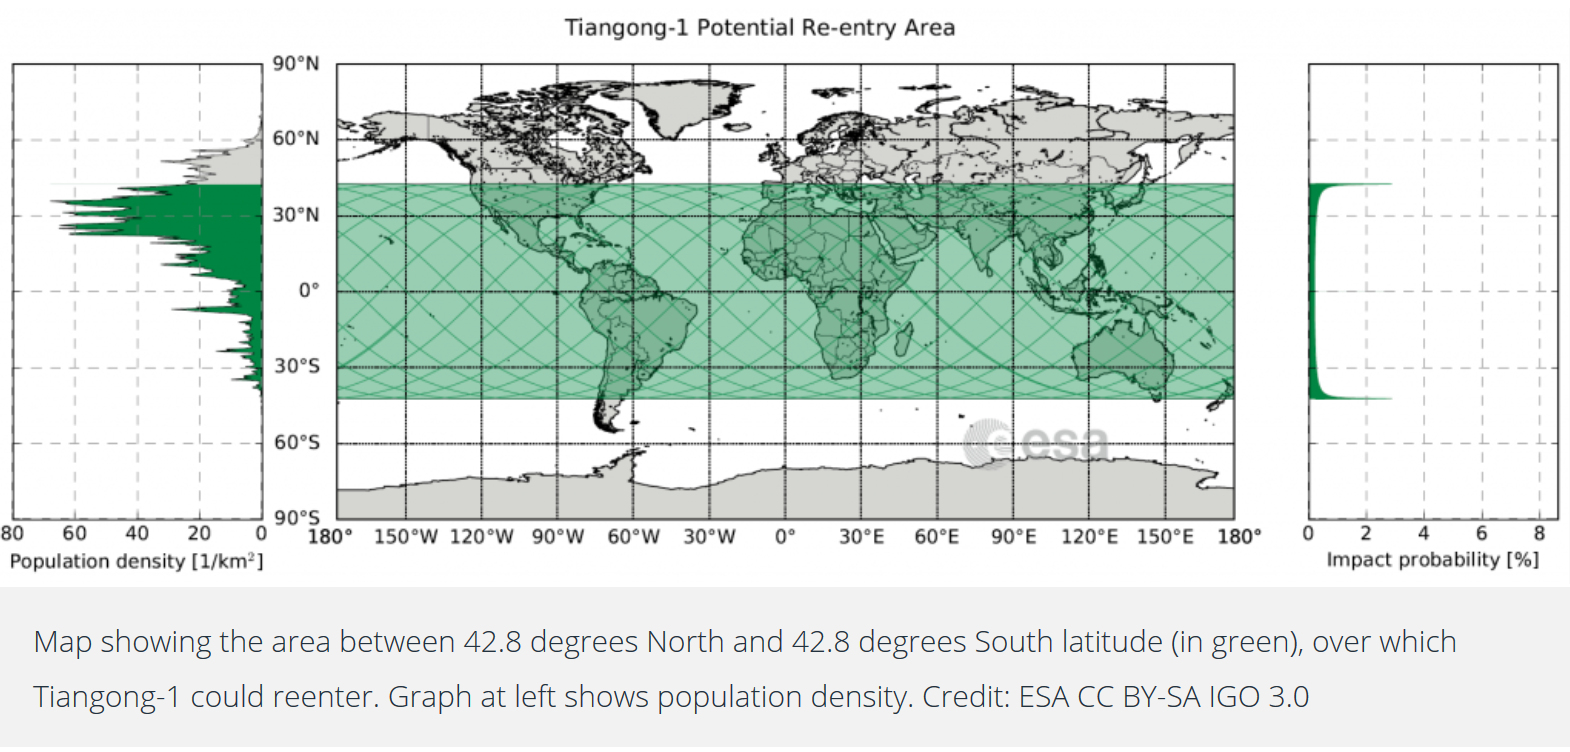
Newcomers to the field are often surprised to learn that a lot happens during solar minimum: The sun dims, albeit slightly. NASA recently launched a new sensor (TSIS-1) to the International Space Station to monitor this effect. With less extreme UV radiation coming from the sun, Earth’s upper atmosphere cools and shrinks. This allows space junk to accumulate in low Earth orbit.

neutrons_stripAbove: A neutron bubble chamber in an airplane 35,000 feet above Greenland. Spaceweather.com and the students of Earth to Sky Calculus are flying these sensors to measure aviation radiation during solar minimum. [more]

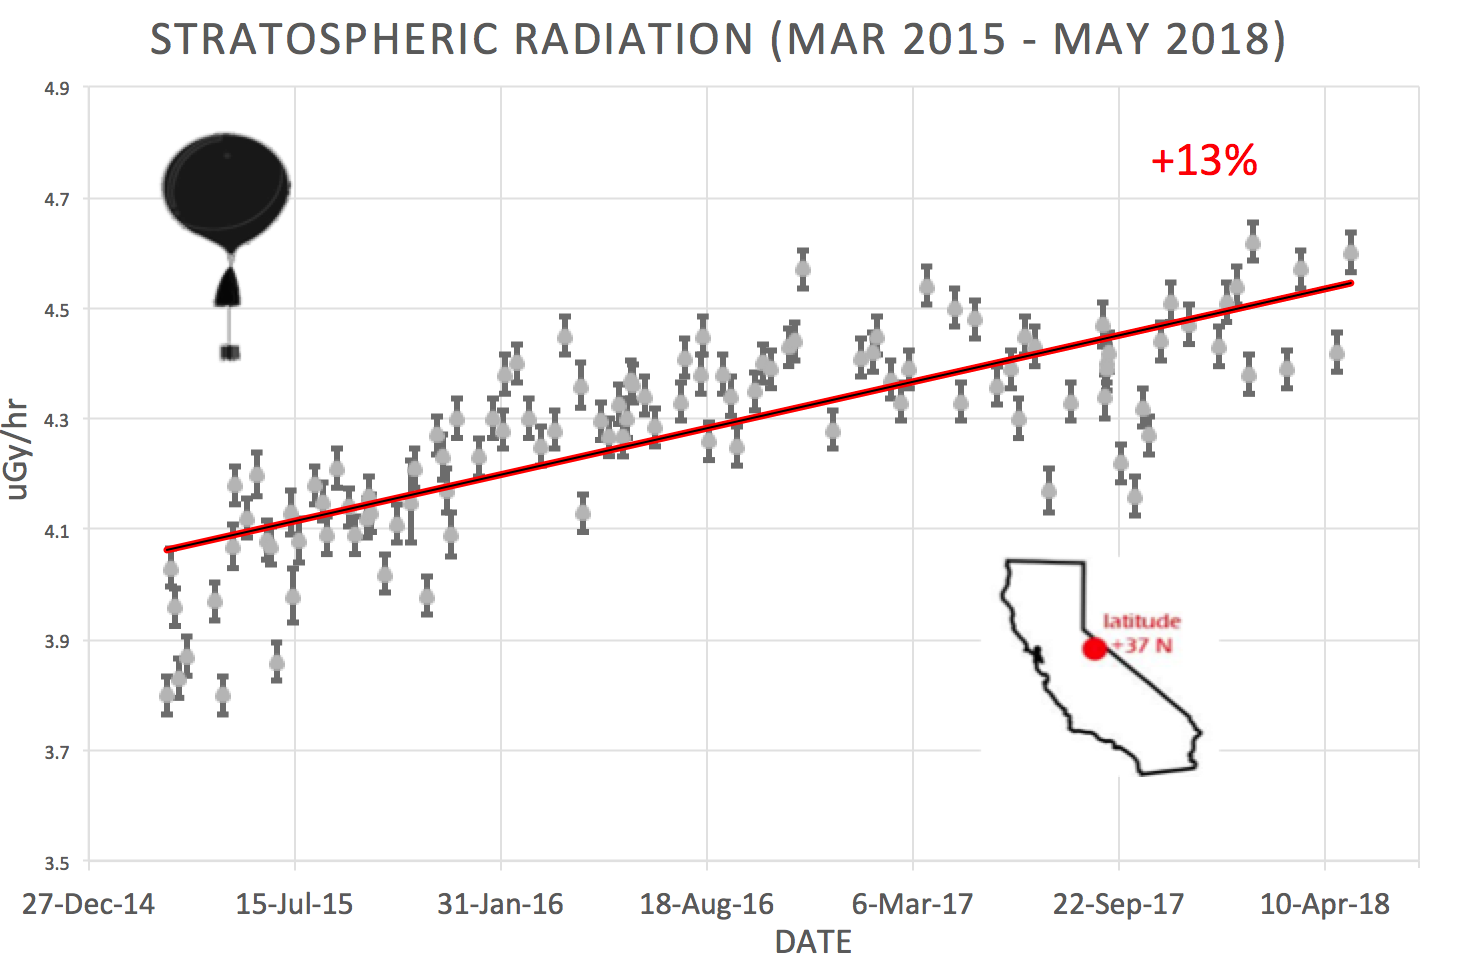
The most important change, however, may be the increase in cosmic rays. Flagging solar wind pressure during solar minimum allows cosmic rays from deep space to penetrate the inner solar system. Right now, space weather balloons and NASA spacecraft are measuring an uptick in radiation due to this effect. Cosmic rays may alter the chemistry of Earth’s upper atmosphere, trigger lightning, and seed clouds.

Air travelers are affected, too. It is well known that cosmic rays penetrate airplanes. Passengers on long commercial flights receive doses similar to dental X-rays during a single trip, while pilots have been classified as occupational radiation workers by the International Commission on Radiological Protection (ICRP). Ongoing measurements by Spaceweather.com and Earth to Sky Calculus show that dose rates at cruising altitudes of 35,000 feet are currently ~40 times greater than on the ground below, values which could increase as the solar cycle wanes.

Solar minimum is just getting started. Stay tuned for updates.

North Korea and Aviation Radiation

April 26, 2018:  For the past 4 years, Spaceweather.com and Earth to Sky Calculus have been flying radiation sensors onboard airplanes to map the distribution of cosmic rays around our planet. Our database currently contains more than 17,000 GPS-tagged radiation measurements spanning 5 continents and 43,000 feet of altitude. Yesterday, we realized we could use this database to investigate a current event–namely, the possibility of a radiation leak from North Korea.


Above: Earth to Sky Calculus X-ray/gamma radiation sensors onboard a plane

North Korea recently surprised observers by announcing a suspension of its underground nuclear testing program. Geologists in China quickly offered an explanation: Mount Mantap, which sits atop of the test site, had collapsed. The mountain crumbled in Sept. 2017 minutes after the North Korean regime exploded a 100 kiloton prototype weapon. According to the South China Morning Post, the China Earthquake Administration believes the collapse may have created a “chimney” that allows the escape of radioactive materials.

Is there any sign of radioactivity in the air space around North Korea? Our database contains four flights near the Korean Peninsula–two in March 2016 (before the collapse), and two more in Feb. 2018  (after the collapse). These are shown in the map, below, where orange circles of 350 miles and 700 miles radius are centered on nuclear test site. During each flight we sampled X-rays and gamma-rays in the energy range 10 keV to 20 MeV at one minute intervals, accumulating more than 600 data points. Low energy X-rays have been used in the past to trace radioactive fallout from atomic tests, so our measurements may have some bearing on the question.


Above: Red dots show where we have collected radiation data in airspace near N. Korea.

And the answer is …. no. Comparing radiation levels pre-collapse vs. post-collapse, we found no significant difference. For instance, radiation dose rates in March 2016 at 31,500 feet were 0.9 uGy/hr (18 times the natural rate at sea level). Radiation dose rates in February 2018 at the same altitude were 1.0 uGy/hr (20 times sea level), a slight increase within the uncertainty of the measurements. If radiation is leaking from the collapsed mountain site, it is not having a detectable effect on aviation over neighboring countries.

Interplanetary Shock Wave Sparks Electric Blue Auroras

April 20, 2018: An interplanetary shock wave hit Earth’s magnetic field on April 19th around 23:50 UT. When the disturbance arrived, the density of solar wind flowing around our planet abruptly quadrupled and a crack opened in Earth’s magnetic field. The resulting G2-class geomagnetic storm sparked unusual “electric blue” auroras.

“I’ve been flying airplanes for 20 years and photographing aurora for 10 years, but I’ve never seen anything like this before,” reports pilot Matt Melnyk who photographed the display from 39,000 feet:

“Electric blue auroras!” he says. “This was while on a red eye flight from Edmonton to Toronto around 4 am over northern Manitoba. Unbelievable sky. I was able to grab some hasty shots with a cell phone.”

Auroras are usually green–a sign of oxygen. Rare blue auroras are caused by nitrogen molecules. Energetic particles striking N2+ at the upper limits of Earth’s atmosphere can produce an azure glow during intense geomagnetic storms.

During the storm, Northern Lights spilled across the Canadian border into the United States as far south as Indiana. Hongming Zheng, a student at Purdue University, saw the blue glow just five miles from his dorm:

“I was preparing for bed at 1:32 am on April 20th when I read that there was an Interplanetary Shockwave,” says Zheng. “I immediately started driving north to see the show. A weak green wisp showed up at 2am and faded, but shortly after 5am a sudden outburst occurred. Purple pillars were easily visible to the naked eye. It’s funny how one minute you are in a humid dorm struggling to get the laundry door closed, and the next minute you are chasing one of the most spectacular phenomenon known to man.”

What is an interplanetary shock wave? It is a supersonic disturbance in the gaseous material of the solar wind. These waves are usually delivered by coronal mass ejections (CMEs). Indeed, this one might have been a minor CME that left the sun unrecognized earlier this week.

Alternately, it might have been an unusually sharp co-rotating interaction region (CIR). CIRs are transition zones between slow- and fast-moving streams of solar wind. They contain plasma density gradients and magnetic fields that often do a good job sparking auroras.

Rare Videos of STEVE

April 11, 2018: Yesterday, a G1-class geomagnetic storm was brewing over Canada as a stream of solar wind buffeted Earth’s magnetic field. Matthew Wheeler of Robson Valley, British Columbia, stepped outside to see what was up–and STEVE appeared. “My dog barked at it for the entire hour it was visible,” says Wheeler. “It was flowing like a river at astonishing speed.” Click to play his must-see video:

STEVE may look like an aurora, but it is not. For one thing, it is soft purple, not green like typical auroras. And it has its own special form–tightly collimated into a narrow ribbon that can bisect the entire sky.

Researchers are only beginning to understand the phenomenon–aided by a chance encounter between STEVE and a European satellite a few years ago. In situ measurements revealed that STEVE is a hot (3000 degrees C) ribbon of ionized gas slicing through Earth’s upper atmosphere some 300 km above the ground. It appears unpredictably during some, but not all, geomagnetic storms.

Another video–“my best yet,” says Wheeler–shows the beautiful interaction between the soft-purple ribbon and nearby green “picket fence” auroras:

“The purple ribbon was moving much faster than the green pickets,” says Wheeler. “And while their forms varied from smooth to ragged and back again, their path across the sky was almost constant for the whole hour–as it has since I first noticed STEVE over this valley in the 1980s.”

Does STEVE really make dogs bark? “Mine does,” says Wheeler. “In addition to barking at STEVE, my giant Akbash astronomy dog, Patch, has barked at the space station since he was a pup, and proudly seen it off the farm every time. He is also a valuable spotter of meteor showers. When I hear him barking upwards, it is time to go outside.”

Realtime Aurora Photo Gallery

China’s Doomed Space Station

March 26, 2018: China’s Tiangong-1 space station is about to return to Earth–as a massive fireball. According to the European Space Agency (ESA), the 8-ton spacecraft will re-enter the atmosphere sometime between March 30th and April 2nd. Tiangong-1 is about the size of a European cargo spacecraft, such as the ATV-1 which itself re-entered in 2008. This re-entry video of the ATV-1 shows what the Tiangong-1 fireball might look like:

Tiangong-1 was launched in Sept. 2011 to establish a foothold in Earth orbit for China’s fledgling space program. It served as a temporary home in space for two crews, including China’s first female astronauts, and provided a testbed for automated rendezvous and docking procedures. China lost control of Tiangong-1 in 2016 when a telemetry link failed. This made it impossible for mission controllers to guide the station to a re-entry over the South Pacific Ocean as originally planned. Instead, Tiangong-1 would re-enter on its own schedule as aerodynamic friction with Earth’s upper atmosphere slowly drained the station’s orbital energy.

Initially, Chinese officials speculated that re-entry would occur in late 2017. However, low solar activity delayed the splashdown. Sunspot numbers have plummeted recently as the solar cycle heads toward a deep solar minimum:

Without sunspots, the sun’s extreme ultraviolet radiation decreased. Earth’s upper atmosphere cooled and contracted, reducing aerodynamic friction that would otherwise bring Tiangong-1 down. “Late 2017” became the spring of 2018.

At the moment it is impossible to predict exactly where Tiangong-1 will re-enter. All we know is that it will disintegrate somewhere between +42.8 and -42.8 degrees latitude, the upper and lower limits of the station’s tilted orbit. This map from the ESA shows the re-entry zone:

Even with an uncontrolled re-entry, the odds strongly favor a descent over uninhabited land or ocean. According to the ESA, “[surviving fragments] will be scattered over a curved ellipsoid that is thousands of km in length and tens of km wide. The personal probability of being hit by a piece of debris from the Tiangong-1 is actually 10 million times smaller than the yearly chance of being hit by lightning.”

In other words, don’t worry. You’ll be lucky just to see the fireball. Approximately one day before the reentry, it will become possible to roughly predict re-entry ground tracks, and hence which regions on Earth might witness the disintegration. Stay tuned for updates.

Strange Aurora-like Arc Sighted over Alaska: It’s “Steve”!

March 25, 2018: Last night, something happened at the edge of space over Alaska. More than 200 km above Anchorage, a hot ribbon of ionized gas sliced through Earth’s magnetosphere, creating a luminous arc that rivaled the Moon in brightness. Sanjana Greenhill witnessed the apparition:

“We noticed this perfect arc developing across the sky,” says Greenhill. “It didn’t seem like the aurora since it wasn’t moving much. The arc got brighter and then faded and then got brighter again. And then it dawned on me, this is STEVE!”

STEVE is an aurora-like phenomenon that researchers are only beginning to understand. For many years, northern sky watchers reported the form occasionally dancing alongside auroras. It was widely called a “proton arc” until researchers pointed out that protons had nothing to do with it. So members of the Alberta Aurora Chasers group gave it a new name: “Steve” (since upgraded to STEVE, an acronym for ‘Strong Thermal Emission Velocity Enhancement’).

The first clues to the nature of STEVE came in 2016 when one of the European Space Agency’s Swarm satellites encountered the phenomenon. “As the satellite flew straight though ‘Steve,’ the temperature jumped by 3000°C and the data revealed a 25 km-wide ribbon of gas flowing westwards at about 6 km/s (13,000 mph),” reports Eric Donovan from the University of Calgary.

Donovan and a team of colleagues led by Elizabeth MacDonald of NASA’s Goddard Space Flight Center have just published a paper on STEVE. In it, they confirm that STEVE is distinct from ordinary auroras, usually forming to the south of active Northern Lights. The mauve and purple colored arcs, they say, are related to supersonic rivers of gas called “subauroral ion drifts” (SAIDs), which flow through Earth’s magnetic field. Earth-orbiting satelites have tracked thousands of SAIDs: they tend to appear near latitude +60 degrees, and occur more frequently during spring and fall than summer and winter.

This last point means that now is the season for STEVE. The onset of northern spring seems to lure the arc out of winter hiding.

“I saw STEVE for the first time on March 18th,” reports Giuseppe Petricca , who took this sequence of pictures from the Isle of Lewis in Scotland:

“It was an ever-changing tornado, with violet tones, always in movement, always with different shapes,” he says. “Another wonder of Nature!”

The mystery of STEVE is far from solved. Researchers still don’t understand why STEVE is purple–or for that matter why the underlying rivers of gas should glow at all. “Further spectral analysis and modeling are needed,” say MacDonald et al.

In other words, keep an eye out for STEVE.

Realtime “Steve” Photo Gallery