Cosmic Radiation Detected on Commercial Flights over the South Pacific

July 9, 2018: Last month, flight attendants got some bad news. According to a new study from researchers at Harvard University, the crews of commercial airlines face an elevated risk of cancer compared to members of the general population. The likely reason: cosmic rays. High energy particles from space hitting the top of Earth’s atmosphere create a spray of secondary radiation that penetrates the walls of airplanes above ~20,000 feet.

We have some new data pertinent to this topic. On June 19th, Spaceweather.com and students of Earth to Sky Calculus flew from California to New Zealand to launch a series of space weather balloons. Naturally, we took our radiation sensors onboard the aircraft. Here is what we measured:

data2

Within minutes after takeoff from Los Angeles, radiation in the passenger compartment multiplied 25-fold and remained high until we landed again in Brisbane 13 hours later. Peak dose rates were almost 40 times greater than on the ground below. In total, we absorbed a whole body dose approximately equal to a panoramic dental X-ray.

Our sensors measure three types of radiation: neutrons, X-rays and gamma-rays. Using bubble chambers, we found that about 1/3rd of our exposure came from neutrons.

neutronchambers_600

Each bubble pictured above is formed by an energetic neutron (200 keV – 15 MeV) passing through the chamber. Counting bubbles yields the total dose–about 8 uGy (micro-greys) of neutrons during the entire flight.

The remaining 2/3rd of our measured exposure came from X-rays and gamma-rays (10 keV to 20 MeV). We detected those forms of radiation using sensors based on Geiger tubes:

xraygammaray

Adding it all together, we detected about 24.3 uGy of neutrons + X-rays + gamma rays during the Los Angeles to Brisbane leg of our flight. For comparison, a panoramic dental X-ray yields between 14 uGy and 24 uGy.

Now for more bad news. Cosmic rays at aviation altitudes are a cocktail of different things: e.g., neutrons, protons, pions, electrons, X-rays, and gamma rays spanning a wide range of energies. Our sensors sample only three ingredients of that cocktail (neutrons, X-rays, gamma-rays) at relatively low energies typical of medical X-rays and airport security devices. This means our data are only the tip of the iceberg. Flight crews and passengers absorb even more radiation than we can detect.

We have taken these sensors on airplanes before, many times. Last year, we took another long international flight, but instead of crossing the equator, we crossed the Arctic Circle. During a polar flight from Los Angeles to Stockholm in March 2017, our sensors detected 43.6 uGy of radiation, almost twice the 24.3 uGy we measured en route to Brisbane in June 2018. This difference is well understood: Earth’s polar magnetic field provides less shielding against cosmic rays, so we expect polar flights to be more “radioactive.”

changingcocktail

What we didn’t expect was the difference in neutrons:  During our Arctic flight, neutron radiation made up fully half of our dose. During our equatorial flight, neutrons amounted to only 1/3rd. In other words, the cocktail changed. These are potentially important differences because neutrons are a biologically effective form of radiation of keen interest to cancer researchers.

Stay tuned for updates as we continue to process our haul of data from 5 plane flights and 3 balloon flights in New Zealand.

What is E-RAD?

Aug. 14, 2018: E-RAD is a new model of aviation radiation from Spaceweather.com and Earth to Sky Calculus. It can predict how much cosmic radiation a passenger will absorb flying on any commercial jet across the USA.

Researchers have long known that cosmic rays penetrate the hulls of commercial aircraft. At typical cruising altitudes, pilots, flight attendants and passengers typically receive a dose rate 40 to 70 times higher than natural radiation on the ground below. The higher a plane flies, the more radiation it receives. This has prompted the International Commission on Radiological Protection (ICRP) to classify pilots as occupational radiation workers–just like nuclear power plant engineers.

Image result for cosmic rays aviation radiation

Most people stepping onboard an airplane have no idea they are about to encounter cosmic rays–much less do they know what the dose rate might be. And that is where E-RAD comes in. Enter a flight number and voila!–E-RAD predicts your exposure to cosmic rays.

This new model has been years in the making. Since Jan. 2015, Spaceweather.com and the students of Earth to Sky Calculus have been monitoring cosmic rays in airplanes. Our method is simple: We board planes carrying the same cosmic ray payload we routinely fly to the stratosphere on space weather balloons. Inside the airplane we measure X-rays, gamma-rays and neutron dose rates, along with GPS altitude, latitude and longitude.

flightpaths
Above: Flight paths forming the basis of our aviation radiation study. 2015-2017

Our data set is impressive. So far we have gathered 18,518 GPS-tagged radiation measurements during 72 flights over 2 oceans and 5 continents. We have spent 276.6 hours onboard planes taking data. These numbers are increasing rapidly with new flights every month.

The E in E-RAD stand for “Empirical.” In other words, the model is based on real-life measurements, not theoretical calculations that might be wrong. Moreover, our data-set is fresh. Because it is constantly being updated, E-RAD naturally keeps up with variables that affect cosmic rays–for instance, the waxing and waning of the solar cycle and changes in Earth’s magnetic field.

At the moment, the bulk of our data (70%) are concentrated over the continental USA, and that is where our predictions are best. For instance, here is a flight from Baltimore to Las Vegas in July 2018:

eradvreality

The blue curve traces radiation dose rates actually observed inside the airplane, while the red curve is E-RAD’s prediction. The two agree within 10% for most of the flight. These errors are constantly shrinking as we add new readings to our database.

We are also improving our model outside the continental USA. Recent trips to Nepal, Hong Kong, Australia and New Zealand, have added hundreds of hours of new data to the foundation of E-RAD.  Soon, we will be able to issue predictions for those areas as well.

Stay tuned for updates from 35,000 feet.

Sprite Lightning Storm

June 10, 2018: This weekend, a powerful mesoscale convective system (MSC) of thunderstorms over central Europe produced a furious outburst of sprites. “It was unreal,” says Martin Popek of Nýdek, Czechia, a veteran photographer of the upward directed bolts. “I recorded more than 250 sprites in only 4.5 hours of observation! That’s nearly as many as I typically see in the entire summer thunderstorm season.”

Many of the sprites during the outburst looked like this:

This is a jellyfish sprite–so called because it resembles the eponymous sea creature. Jellyfish sprites are typically very large, stretching as much as 50 km between the tops of their heads to the tips of their tentacles below. “Regular jellyfish sprites are associated with very strong positive cloud-to-ground lightning strokes in the underlying convective storms,” notes lightning scientist Oscar van der Velde of the Technical University of Catalonia, Spain.

However, not all of the jellyfish were regular. Some were “decapitated”–without heads. “I recorded about 20 sets of tentacles only,” says Popek. Here is one example of many:

“In my experience, this is quite rare,” he adds.

“It is rare,” agrees van der Velde. “We don’t know why they sometimes look like this.” He speculates that atmospheric waves called “gravity waves” sometimes interfere with the normal formation of jellyfish, leaving them headless. “Mesospheric gravity waves likely help focus the electric field to trigger downward streamers,” he says. “But note that sprite morphology is not fully understood–not even for regular jellyfish. We have a lot to learn.”

Another observer in the Czech Republic, Daniel Ščerba-Elza, also photographed the display. “It was extremely active,” says Ščerba-Elza. “I recorded about 69 sprites, much more than usual. The storms were about 250 – 300 km away in Austria and Hungary. This is a good distance because it allows you to see over the tops of the thunderheads.” He made a summary video of the outburst.

Such an outburst before summer even begins may be a good omen for sprite photographers as thunderstorm season gains steam. Stay tuned for more sightings.

Realtime Sprite Photo Gallery

Global Cosmic Radiation Measurements

June 10, 2018: For the past two years, Spaceweather.com and the students of Earth to Sky Calculus have been traveling around the world, launching cosmic ray balloons to map our planet’s radiation environment. Our sensors travel from ground level to the stratosphere and bring their data back to Earth by parachute. Here is a plot showing radiation vs. altitude in Norway, Chile, Mexico, and selected locations in the USA:


Note: Data from Sweden and several other US states are omitted for the clarity of the plot.

We’re about to add a new country to the list: New Zealand. On June 18th, a team of students from Earth to Sky is traveling to New Zealand’s north island to launch 3 cosmic ray balloons in only 10 days. Soon, we will know more about cosmic rays above Earth’s 8th continent.

Cosmic rays are, essentially, the subatomic debris of dying stars, accelerated to nearly light speed by supernova explosions. They travel across space and approach Earth from all directions, peppering our planet 24/7. When cosmic rays crash into Earth’s atmosphere, they produce a spray of secondary particles and photons that is most intense at the entrance to the stratosphere. This secondary spray is what we measure.

The purpose of our mapping project is to study how well Earth’s atmosphere and magnetic field protects us from cosmic rays. As the plot shows, the shielding is uneven. More radiation gets through to the poles (e.g., Norway) and less radiation penetrates near the equator (e.g., Mexico).

But there’s more to the story. Our launch sites in Chile and California are equidistant from the equator, yet their radiation profiles are sharply different. Chile is on the verge of the South Atlantic Anomaly, which almost surely distorts the radiation field there. Our flights over New Zealand may shed some light on this, because our launch sites in New Zealand will be the same distance from the equator as the sites in Chile. Stay tuned!

Technical note: The radiation sensors onboard our helium balloons detect X-rays and gamma-rays in the energy range 10 keV to 20 MeV. These energies span the range of medical X-ray machines and airport security scanners.

Mars Outshines Sirius

June 10, 2018: It’s official. Mars is now brighter than any star in the sky. Last week, the Red Planet surpassed Sirius in apparent luminosity. If you wake up before dawn, you can’t help noticing Mars burning through the morning twilight with a distinctive orange glow. This morning in Burgundy, France, photographer Jean-Baptiste Feldmann captured the planet shining over the castle Clos de Vougeot:

“It truly was brighter than any star in the sky,” says Feldmann.

What’s happening? Earth and Mars are converging for a close encounter–the best one in 15 years. On July 27th, Mars will be at opposition. Oppositions of Mars happen roughly every 2 years, but this one is special. It is a “perihelic opposition.” Mars will be near perihelion, its closest approach to the sun. Perihelic oppositions also bring Mars extra-close to Earth.

The last time this happened was on Aug. 27, 2003, when Mars famously made its closest approach to Earth in almost 60,000 years. Around the world, people organized “Mars parties” to celebrate the extraordinary size and brightness of the Red Planet. This July will be almost as good with Mars only a few percent farther away than it was during its historic encounter 15 years ago. Between now and then, Mars will triple in brightness, outshining even the giant planet Jupiter. Stay tuned for that!

Realtime Mars Photo Gallery

What is the Regener-Pfotzer Maximum?

June 7, 2018: About once a week, Spaceweather.com and the students of Earth to Sky Calculus launch a helium balloon with radiation  sensors to the stratosphere over California. This is a unique monitoring program aimed at tracking the cosmic ray situation in Earth’s atmosphere. During each flight, our balloon passes through something called the Regener-Pfotzer Maximum, a layer of peak radiation about 20 km above Earth’s surface. This plot of radiation vs. time taken during a July 2015 balloon flight illustrates the peak:

figure1_agu
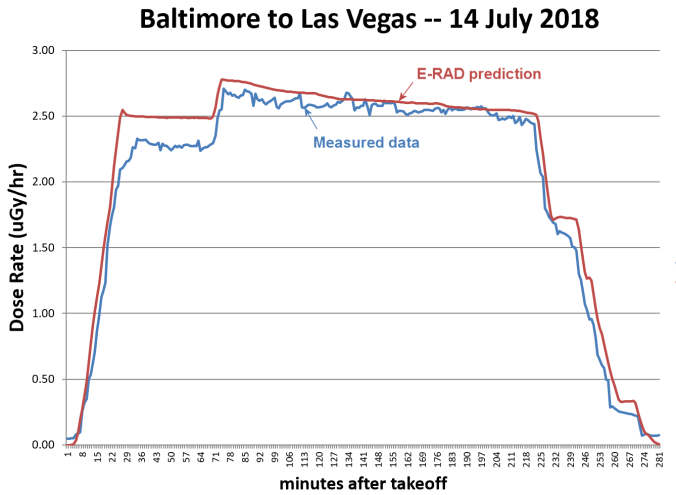
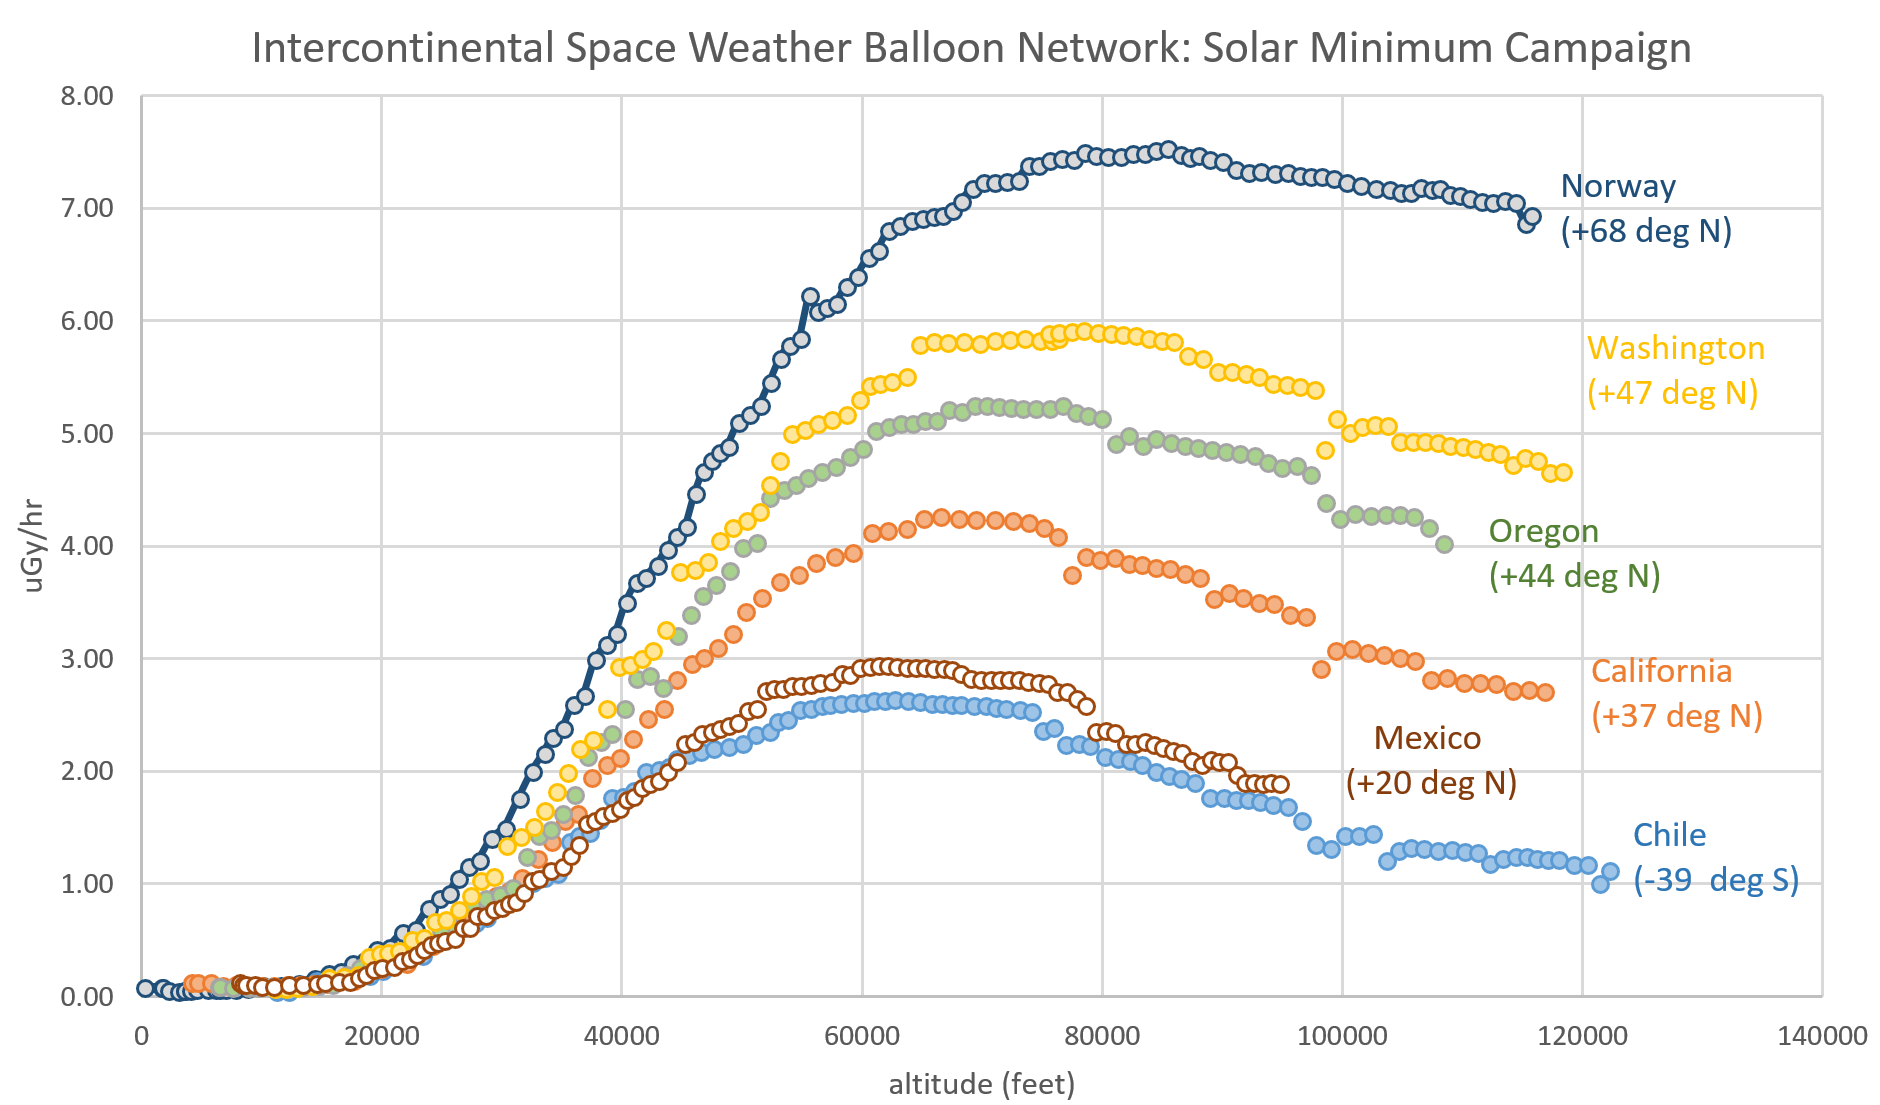
Image source: Phillips, T., et al. (2016), Space Weather Ballooning, Space Weather, 14, 697–703, doi: 10.1002/2016SW001410.

What is this peak? To understand it, let us begin in deep space. Cosmic rays are, essentially, the subatomic debris of dying stars, accelerated to nearly light speed by supernova explosions. They travel across space and approach Earth from all directions, peppering our planet 24/7. When cosmic rays crash into Earth’s atmosphere, they produce a spray of secondary particles and photons that is most intense at the entrance to the stratosphere. Physicists Eric Regener and Georg Pfotzer discovered the maximum using balloons in the 1930s and it is what we are measuring today.

In some ways, secondary cosmic rays are like froth on the ocean. By watching the froth, you can learn a lot about the underlying water. Likewise, by watching secondary cosmic rays, we learn a lot about primary cosmic rays hitting the top of the atmosphere. Indeed, our balloon measurements have recently confirmed what NASA spacecraft are finding: The cosmic ray situation is worsening.

cr_strip

For many years, the Regener-Pfotzer Maximum was called, simply, the “Pfotzer Maximum.” Regener’s name is less recognized by present-day physicists largely because in 1937 he was forced to take early retirement by the National Socialists as his wife had Jewish ancestors. This interesting story weaving science, politics, and human nature has recently been told by historians of science P. Carlson and A. A. Watson. Ref: Hist. Geo Space. Sci., 5, 175-182, 2014.

Technical note: The radiation sensors onboard our helium balloons detect X-rays and gamma-rays in the energy range 10 keV to 20 MeV. These energies span the range of medical X-ray machines and airport security scanners.

We’re Going to New Zealand!

June 6, 2018: For the past two years, Spaceweather.com and the students of Earth to Sky Calculus have been traveling around the world, launching cosmic ray balloons to map our planet’s radiation environment. We’ve sampled deep space radiation over Sweden, Mexico, Norway, Chile and almost a dozen US states. This month we’re adding New Zealand to the list. On June 18th, a team of 11 Earth to Sky students and two mentors will fly from California to the north island of New Zealand, where we will launch 3 research balloons in only 10 days.

Our hosts are Terry and Linda Coles of Enternet Online Limited (EOL), a leading New Zealand internet service provider based in Tauranga. EOL has been a supporter of Earth to Sky Calculus for many years. They sponsored one of our earliest balloon launches in 2013 when we flew their mascot, EVA the Cow, to the stratosphere. While we are in New Zealand, they will be donating all of our lodging and transportation. Thanks again, EOL!

Not only will we be measuring cosmic rays, but also we will train New Zealand students to launch balloons, hopefully kickstarting a STEM balloon program in the southern hemisphere. Five schools are participating: 1. Mount Maunganui College; 2. Otumoetai College; 3. Tauranga Girls College; 4. Tauranga Boys College; and 5 Bethlehem College. Some of those schools will be sending their own experiments to the stratosphere alongside Earth to Sky radiation sensors.

We can’t wait to get to New Zealand and share our adventure. Stay tuned for more information about what we hope to learn about cosmic rays by visiting the 8th continent.

The Epicenter of Sprite Alley

June 2, 2018: Oklahoma is a good place to see sprites. “I photograph them often,” says Paul Smith of Edmond OK. “Here are some examples from May 30th flashing above fast-moving storms in the Oklahoma panhandle.”

“Venus is the bright ‘star’ just behind the windmill,” he adds.

Oklahoma is the epicenter of a region that we call “Sprite Alley,” a corridor stretching across the US Great Plains where intense thunderstorms produce lots of upward directed lightning–a.k.a. “sprites.”

“I have been recording sprites since last summer when I accidentally caught a few during the Perseid meteor shower,” says Smith. “I now have a couple of hundred events on camera and I am out almost every night there are storms in my vicinity.”

The blue pushpin in the satellite weather map, above, shows Smith’s location. The blue arrow points to the storm cell that produced the sprites.

People have been seeing sprites since at least the 19th century, but those early reports were often met with skepticism. Sprites entered the mainstream in 1989 when researchers from the University of Minnesota finally captured them on film. Subsequent video footage from the space shuttle cemented their status as an authentic physical phenomenon.

In recent years, citizen scientists have been photographing sprites in record numbers. But why? It could be a result of raised awareness. More photographers know about sprites, so naturally more sprite photos are taken.  There might also be a real increase in sprite activity. Some researchers think that sprites are linked to cosmic rays: Subatomic particles from deep space strike the top of Earth’s atmosphere, producing secondary electrons that trigger the upward bolts. Indeed, cosmic rays are now intensifying due to the decline of the solar cycle.

It all adds up to more sprites over Oklahoma. More examples may be found on Paul Smith’s Facebook page.

Realtime Sprite Photo Gallery

Jellyfish Sprites over Oklahoma

May 25, 2018: Last night, a swarm of luminous jellyfish appeared over Oklahoma. “A swarm of jellyfish sprites, that is,” says Paul Smith, who photographed them rising above an intense thunderstorm near Oklahoma City:

“The sprites were about 80 miles away from me,” says Smith. “At that distance I could see over the tops of the storm cells where the jellyfish appear. I’ve photographed many sprites from 200 to 300 miles away. These, however, were unusually nearby, and they are my best pictures yet.”

Sprites are an exotic form of upward directed lightning. Although the forms have been seen for at least a century, many scientists did not believe they existed until after 1989 when sprites were photographed by cameras onboard the space shuttle. Now “sprite chasers” like Smith routinely photograph them from their own homes.

“I have been recording sprites since last summer when I accidentally caught a few during the Perseid meteor shower,” says Smith. “I have a couple of hundred events on camera now and I am out almost every night there are storms in my vicinity. This month I have driven for five hours some nights trying to find a clear view over active cells.”


The blue pushpin is Smith’s location; the arrow points to the sprites he saw on May 24, 2018.

Oklahoma is the epicenter of a region that we call “Sprite Alley”–a corridor stretching across the US Great Plains where intense thunderstorms produce lots of upward directed lightning. Already this year we have received reports of sprites and their stronger cousins, Gigantic Jets, from Texas to Nebraska. And summer thunderstorm season isn’t even fully underway yet.

Some researchers think that sprites may be linked to cosmic rays: Subatomic particles from deep space strike the top of Earth’s atmosphere, producing secondary electrons that trigger the upward bolts. If this is true, then sprites could multiply in the months and years ahead as cosmic rays intensify due to the decline of the solar cycle. More sprite images may be found on Paul Smith’s Facebook page.

Realtime Sprite Photo Gallery

Lunar Eclipses and Climate Change

May 24, 2018: Strange but true: You can learn a lot about Earth’s climate by watching a lunar eclipse. This week at the 46th Global Monitoring Annual Conference (GMAC) in Boulder, CO, climate scientist Richard Keen of the University of  Colorado announced new results from decades of lunar eclipse monitoring.

“Based on the color and brightness of recent eclipses, we can say that Earth’s stratosphere is as clear as it has been in decades. There are very few volcanic aerosols up there,” he explains. This is important, climatologically, because a clear stratosphere “lets the sunshine in” to warm the Earth below.

twostratospheres

To illustrate the effect that volcanic aerosols have on eclipses, Keen prepared a side-by-side comparison (above) of a lunar eclipse observed in 1992 after the Philippine volcano Pinatubo spewed millions of tons of gas and ash into the atmosphere vs. the latest “all-clear” eclipse in January 2018.

“Compared to the murky decades of the el Chichon and Pinatubo, the clear stratosphere since 1995 has allowed the intensity of sunlight reaching the ground to increase by about 0.6 Watts per square meter,” says Keen. “That’s equivalent to a warming of 1 or 2 tenths of a degree C (0.1 C to 0.2 C).”

“In other words,” he adds, “over the past 40 years, the decrease of volcanic aerosols and the increase of greenhouse gases have contributed equally to the total warming (~0.3 C) observed in global satellite temperature records.”

poster_strip

Total lunar eclipses happen somewhere on Earth typically once or twice a year. Keen is looking forward to the next one on July 27, 2018, which will be the longest lunar eclipse of the century. The Moon will pass almost directly through the middle of Earth’s shadow, remaining inside for 1 hour and 43 minutes. That’s just a few minutes shy of the theoretical maximum.

“This will give us plenty of time to measure the color and brightness of Earth’s shadow and, thus, the aerosol content of the stratosphere,” says Keen.

For more information about lunar eclipses and climate change, check out Keen’s poster from the GMAC.